Breast Cancer Screening (PDQ®): Screening - Health Professional Information [NCI]
Breast Cancer Screening (PDQ®): Screening - Health Professional Information [NCI]Skip to the navigationOverviewNote: Separate PDQ summaries on Breast Cancer Prevention, Breast Cancer Treatment, Male Breast Cancer Treatment, and Breast Cancer Treatment and Pregnancy are also available. This summary covers the topic of breast cancer screening and includes information about breast cancer incidence and mortality, risk factors for breast cancer, the process of breast cancer diagnosis, and the benefits and harms of various breast cancer screening modalities. This summary also includes information about screening among special populations. Mammography is the most widely used screening modality, with solid evidence of benefit for women aged 40 to 74 years. Clinical breast examination and breast self-exam have also been evaluated but are of uncertain benefit. Technologies such as ultrasound, magnetic resonance imaging, tomosynthesis, and molecular breast imaging are being evaluated, usually as adjuncts to mammography. Screening With Mammography Benefits Based on solid evidence, screening mammography may lead to the following benefit: - Decrease in breast cancer mortality
| Magnitude of Effect: In the randomized controlled trials (RCTs), for women aged 40 to 74 years, screening with mammography has been associated with a 15% to 20% relative reduction in mortality from breast cancer.[1] Absolute mortality benefit for women screened annually for 10 years is approximately 1% overall, ranging from 4 per 10,000 women who start screening at age 40 years to 50 per 10,000 women who start at age 50 years.[2] Based on the 25-year follow-up from the Canadian National Breast Screening Study (CNBSS), an RCT of breast cancer screening,[3] there is some uncertainty about the magnitude of benefit of mammography in the present day. | | Study Design: RCTs, population-based evidence. | | Internal Validity: Variable, but meta-analysis of RCTs good. | | Consistency: Fair. | | External Validity: Good. |
Harms Based on solid evidence, screening mammography may lead to the following harms: - Overdiagnosis and Resulting Treatment of Insignificant Cancers: Diagnosis of cancers that would otherwise never have caused symptoms or death in a woman's lifetime can expose a woman to the immediate risks of therapy (surgical deformity or toxicities from radiation therapy, hormone therapy, or chemotherapy), late sequelae (lymphedema), and late effects of therapeutic radiation (new cancers, scarring, or cardiac toxicity). Although the specific plan of recommended treatment is typically tailored to individual tumor characteristics, at this time, there is no reliable way to distinguish which cancer would never progress in an individual patient; therefore, some treatment is nearly always recommended.
| Magnitude of Effect: Varies with patient age, life expectancy, and tumor type (ductal carcinoma in situ and/or invasive).[4,5] Of all breast cancers detected by screening mammograms, up to 54% are estimated to be results of overdiagnosis.[6] The best estimations of overdiagnosis come from either long-term follow-up of RCTs of screening or the calculation of excess incidence in large screening programs. Although there are uncertainties with each approach, follow-up of the long-term CNBSS and well-conducted excess incidence studies in the United States [7] and Scandinavia [8,9] found that at least 20% of screen-detected breast cancers are overdiagnosed. | | Study Design: Descriptive population-based comparisons, autopsy series, and series of mammary reduction specimens. |
- False Positives with Additional Testing and Anxiety.
| Magnitude of Effect: On average, 10% of women will be recalled from each screening examination for further testing, and only 5 of the 100 women recalled will have cancer.[10] Approximately 50% of women screened annually for 10 years in the United States will experience a false positive, of whom 7% to 17% will have biopsies.[11,12] Additional testing is less likely when prior mammograms are available for comparison. | | Study Design: Descriptive population-based. |
- False Negatives with False Sense of Security and Potential Delay in Cancer Diagnosis.
| Magnitude of Effect: 6% to 46% of women with invasive cancer will have negative mammograms, especially if they are young, have dense breasts,[13,14] or have mucinous, lobular, or rapidly growing cancers.[15] | | Study design: Descriptive population-based. |
- Radiation-Induced Breast Cancer: Radiation-induced mutations can cause breast cancer, especially if exposure occurs before age 30 years and is at high doses, such as from mantle radiation therapy for Hodgkin disease. The breast dose associated with a typical two-view mammogram is approximately 4 mSv and extremely unlikely to cause cancer. One Sv is equivalent to 200 mammograms. Latency is at least 8 years, and the increased risk is lifelong.[16,17]
| Magnitude of Effect: Theoretically, annual mammograms in women aged 40 to 80 years may cause up to one breast cancer per 1,000 women.[16,17] | | Study design: Descriptive population-based. |
For all these potential harms of screening mammography, internal validity, consistency and external validity are good. Clinical Breast Examination Benefits Clinical breast examination (CBE) has not been tested independently; it was used in conjunction with mammography in one Canadian trial, and was the comparator modality versus mammography in another trial. Thus, it is not possible to assess the efficacy of CBE as a screening modality when it is used alone versus usual care (no screening activity). | Magnitude of Effect: The current evidence is insufficient to assess the additional benefits and harms of CBE. The single RCT comparing high-quality CBE with screening mammography showed equivalent benefit for both modalities. Accuracy in the community setting might be lower than in the RCT. | | Study Design: Single RCT, population cohort studies. | | Internal Validity: Good. | | Consistency and External Validity: Poor. |
Harms Screening by CBE may lead to the following harms: - False Positives with Additional Testing and Anxiety.
| Magnitude of effect: Specificity in women aged 50 to 59 years was 88% to 99%, yielding a false-positive rate of 1% to 12%.[18] | | Study Design: Descriptive population-based. | | Internal Validity, Consistency and External Validity: Good. |
- False Negatives with Potential False Reassurance and Delay in Cancer Diagnosis.
| Magnitude of Effect: Of women with cancer, 17% to 43% have a negative CBE. Sensitivity is higher with longer duration and higher quality of the examination by trained personnel. | | Study Design: Descriptive population-based. | | Internal and External Validity: Good. | | Consistency: Fair. |
Breast Self-Examination Benefits Breast self-examination (BSE) has been compared with usual care (no screening activity) and has not been shown to reduce breast cancer mortality. | Magnitude of Effect: No effect.[19,20] | | Study Design: Two RCTs. | | Internal Validity and Consistency: Fair. | | External Validity: Poor. |
Harms Based on solid evidence, formal instruction and encouragement to perform BSE leads to more breast biopsies and diagnosis of more benign breast lesions. | Magnitude of Effects on Health Outcomes: Biopsy rate was 1.8% among the study population compared with 1.0% among the control group.[19] | | Study Design: Two RCTs, cohort studies. | | Internal Validity: Good. | | Consistency: Fair. | | External Validity: Poor. |
References:
-
Nelson HD, Tyne K, Naik A, et al.: Screening for breast cancer: an update for the U.S. Preventive Services Task Force. Ann Intern Med 151 (10): 727-37, W237-42, 2009.
-
Moss SM, Cuckle H, Evans A, et al.: Effect of mammographic screening from age 40 years on breast cancer mortality at 10 years' follow-up: a randomised controlled trial. Lancet 368 (9552): 2053-60, 2006.
-
Miller AB, Wall C, Baines CJ, et al.: Twenty five year follow-up for breast cancer incidence and mortality of the Canadian National Breast Screening Study: randomised screening trial. BMJ 348: g366, 2014.
-
Yen MF, Tabár L, Vitak B, et al.: Quantifying the potential problem of overdiagnosis of ductal carcinoma in situ in breast cancer screening. Eur J Cancer 39 (12): 1746-54, 2003.
-
Welch HG, Black WC: Overdiagnosis in cancer. J Natl Cancer Inst 102 (9): 605-13, 2010.
-
Zahl PH, Strand BH, Maehlen J: Incidence of breast cancer in Norway and Sweden during introduction of nationwide screening: prospective cohort study. BMJ 328 (7445): 921-4, 2004.
-
Bleyer A, Welch HG: Effect of three decades of screening mammography on breast-cancer incidence. N Engl J Med 367 (21): 1998-2005, 2012.
-
Kalager M, Zelen M, Langmark F, et al.: Effect of screening mammography on breast-cancer mortality in Norway. N Engl J Med 363 (13): 1203-10, 2010.
-
Jørgensen KJ, Gøtzsche PC: Overdiagnosis in publicly organised mammography screening programmes: systematic review of incidence trends. BMJ 339: b2587, 2009.
-
Rosenberg RD, Yankaskas BC, Abraham LA, et al.: Performance benchmarks for screening mammography. Radiology 241 (1): 55-66, 2006.
-
Elmore JG, Barton MB, Moceri VM, et al.: Ten-year risk of false positive screening mammograms and clinical breast examinations. N Engl J Med 338 (16): 1089-96, 1998.
-
Hubbard RA, Kerlikowske K, Flowers CI, et al.: Cumulative probability of false-positive recall or biopsy recommendation after 10 years of screening mammography: a cohort study. Ann Intern Med 155 (8): 481-92, 2011.
-
Rosenberg RD, Hunt WC, Williamson MR, et al.: Effects of age, breast density, ethnicity, and estrogen replacement therapy on screening mammographic sensitivity and cancer stage at diagnosis: review of 183,134 screening mammograms in Albuquerque, New Mexico. Radiology 209 (2): 511-8, 1998.
-
Kerlikowske K, Grady D, Barclay J, et al.: Likelihood ratios for modern screening mammography. Risk of breast cancer based on age and mammographic interpretation. JAMA 276 (1): 39-43, 1996.
-
Porter PL, El-Bastawissi AY, Mandelson MT, et al.: Breast tumor characteristics as predictors of mammographic detection: comparison of interval- and screen-detected cancers. J Natl Cancer Inst 91 (23): 2020-8, 1999.
-
Ronckers CM, Erdmann CA, Land CE: Radiation and breast cancer: a review of current evidence. Breast Cancer Res 7 (1): 21-32, 2005.
-
Goss PE, Sierra S: Current perspectives on radiation-induced breast cancer. J Clin Oncol 16 (1): 338-47, 1998.
-
Fenton JJ, Rolnick SJ, Harris EL, et al.: Specificity of clinical breast examination in community practice. J Gen Intern Med 22 (3): 332-7, 2007.
-
Thomas DB, Gao DL, Ray RM, et al.: Randomized trial of breast self-examination in Shanghai: final results. J Natl Cancer Inst 94 (19): 1445-57, 2002.
-
Semiglazov VF, Manikhas AG, Moiseenko VM, et al.: [Results of a prospective randomized investigation [Russia (St.Petersburg)/WHO] to evaluate the significance of self-examination for the early detection of breast cancer]. Vopr Onkol 49 (4): 434-41, 2003.
Description of the EvidenceBackground Breast cancer incidence and mortality Breast cancer is the most common noncutaneous cancer in U.S. women, with an estimated 63,410 cases of in situ disease, 252,710 new cases of invasive disease, and 40,610 deaths expected in 2017.[1] Thus, fewer than 1 of 6 women diagnosed with breast cancer die of the disease. By comparison, about 71,280 American women are estimated to die of lung cancer in 2017.[1] Males account for 1% of breast cancer cases and breast cancer deaths (refer to the Special Populations section of this summary for more information). Widespread adoption of screening increases breast cancer incidence in a given population and changes the characteristics of cancers detected, with increased incidence of lower-risk cancers, premalignant lesions, and ductal carcinoma in situ (DCIS). (Refer to the Ductal Carcinoma In Situ section in the Breast Cancer Diagnosis and Pathology section of this summary for more information.) Ecologic studies from the United States [2] and the United Kingdom [3] demonstrate an increase in DCIS and invasive breast cancer incidence since the 1970s, attributable to the widespread adoption of both postmenopausal hormone therapy and screening mammography. In the last decade, women have refrained from using postmenopausal hormones, and breast cancer incidence has declined, but not to the levels seen before the widespread use of screening mammography.[4] One might expect that if screening identifies cancers before they cause clinical symptoms, then the period of screening will be followed by a period of compensatory decline in cancer rates, either in annual population incidence rates or in incidence rates in older women. However, no compensatory drop in incidence rates has ever been seen following the adoption of screening, suggesting that screening leads to overdiagnosis-the identification of clinically insignificant cancers (refer to the Overdiagnosis section in the Harms of Screening section of this summary for more information). Breast cancer incidence and mortality risk also vary according to geography, culture, race, ethnicity, and socioeconomic status (refer to the Special Populations section of this summary for more information). Pathologic evaluation of breast symptoms Women with breast symptoms are not candidates for screening because they require a diagnostic evaluation. During a 10-year period, 16% of 2,400 women aged 40 to 69 years sought medical attention for breast symptoms at their health maintenance organization.[5] Women younger than 50 years were twice as likely to seek evaluation. Additional testing was performed in 66% of these women, including invasive procedures performed in 27%. Cancer was diagnosed in 6.2% of these women, most often as stage II or stage III. Of the breast symptoms prompting medical attention, a mass was most likely to lead to a cancer diagnosis (10.7%) and pain was least likely (1.8%) to do so. Risk Factors for Breast Cancer Breast cancer risk is affected by many factors besides participation in screening activities. Understanding and quantifying these risks is important to a woman, to her physicians, and to public policy makers. (Refer to the PDQ summary on Breast Cancer Prevention for a complete description of factors associated with an increased or decreased risk of breast cancer.) References:
-
American Cancer Society: Cancer Facts and Figures 2017. Atlanta, Ga: American Cancer Society, 2017. Available online. Last accessed May 25, 2017.
-
Altekruse SF, Kosary CL, Krapcho M, et al.: SEER Cancer Statistics Review, 1975-2007. Bethesda, Md: National Cancer Institute, 2010. Also available online. Last accessed March 9, 2017.
-
Johnson A, Shekhdar J: Breast cancer incidence: what do the figures mean? J Eval Clin Pract 11 (1): 27-31, 2005.
-
Haas JS, Kaplan CP, Gerstenberger EP, et al.: Changes in the use of postmenopausal hormone therapy after the publication of clinical trial results. Ann Intern Med 140 (3): 184-8, 2004.
-
Barton MB, Elmore JG, Fletcher SW: Breast symptoms among women enrolled in a health maintenance organization: frequency, evaluation, and outcome. Ann Intern Med 130 (8): 651-7, 1999.
Pathologic Evaluation of Breast TissuePathologic Diagnosis of Invasive Breast Cancer Breast cancer is most often diagnosed by pathologic review of a fixed specimen of breast tissue. The breast tissue can be obtained from a symptomatic area or from an area identified by an imaging test. A palpable lesion can be biopsied with core needle biopsy or, less often, fine-needle aspiration biopsy or surgical excision; image guidance improves accuracy. Nonpalpable lesions can be sampled by core needle biopsy using stereotactic x-ray or ultrasound guidance or can be surgically excised after image-guided localization. In a retrospective study of 939 patients with 1,042 mammographically detected lesions who underwent core needle biopsy or surgical needle localization under x-ray guidance, sensitivity of core needle biopsy for malignancy was greater than 95% and the specificity was about 90%. Compared with surgical needle localization under x-ray guidance, core needle biopsy resulted in fewer surgical procedures for definitive treatment, with a higher likelihood of clear surgical margins at the initial excision.[1] Pathologic Diagnosis of Ductal CarcinomaIn Situ Ductal carcinoma in situ (DCIS) is a noninvasive condition that can evolve to invasive cancer, with variable frequency and time course.[2] Some authors include DCIS with invasive breast cancer statistics, but others argue that the term be replaced by ductal intraepithelial neoplasia, similar to the terminology used for cervical and prostate precursor lesions, and that breast cancer statistics exclude DCIS. DCIS is most often diagnosed by mammography. In the United States, only 4,900 women were diagnosed with DCIS in 1983, compared with approximately 63,410 women who are expected to be diagnosed in 2017, when mammographic screening has been widely adopted.[2,3,4] The Canadian National Breast Screening Study-2 of women aged 50 to 59 years found a fourfold increase in DCIS cases in women screened by clinical breast examination (CBE) plus mammography compared with those screened by CBE alone, with no difference in breast cancer mortality.[5] (Refer to the PDQ summary on Breast Cancer Treatment for more information.) The natural history of DCIS is poorly understood because nearly all DCIS cases are treated. A single retrospective review of 11,760 breast biopsies performed between 1952 and 1968 identified 28 cases of DCIS,[6,7] which were detected by physical examination, biopsied without resection, and then followed for 30 years. Nine women developed invasive breast cancer and four women died of the disease. These findings are interesting but probably not relevant to women with screen-detected DCIS in an era of improved cancer care. Development of breast cancer after treatment of DCIS depends on the characteristics of the lesion but also on the delivered treatment. One large randomized trial found that 13.4% of women treated by lumpectomy alone developed ipsilateral invasive breast cancer within 90 months, compared with 3.9% of those treated by lumpectomy and radiation.[8] The best evidence indicates that most DCIS lesions will not evolve to invasive cancer and that those that do can still usually be managed successfully, even after that transition. Thus, the detection and treatment of nonpalpable DCIS often represents overdiagnosis and overtreatment. Among women diagnosed with (and treated for) DCIS between 1984 and 1989, 1.9% died of breast cancer within 10 years,[9] which was a lower mortality rate than for the age-matched population at large. This favorable outcome may reflect the benign nature of the condition, the benefits of treatment, or the volunteer effect (women undergoing breast cancer screening are generally healthier than those who do not). Attempts to define low-risk DCIS cases that can be managed with fewer therapies are important. One such effort analyzed a series of 706 DCIS patients who were monitored to develop the University of Southern California/Van Nuys Prognostic Scoring Index, which defines the risk of recurrent DCIS and invasive cancer among women with DCIS based on age, margin width, tumor size, and grade.[10] The low-risk group, comprising one-third of the cases, experienced only 1% of DCIS recurrences and no invasive cancers, independent of the use of postoperative radiation therapy. The moderate- and high-risk groups had higher recurrence rates, and they benefited from postlumpectomy radiation therapy. Overall, approximately 1% died of breast cancer. In a separate study, adjuvant tamoxifen therapy was shown to reduce the incidence of invasive breast cancer.[11] Pathologic Diagnosis of Atypia The prevalence of atypia is low, ranging from 4% to 10% of breast biopsies.[12,13] However, the large number of breast biopsies performed each year, estimated to be 1.6 million in the United States alone,[14,15] translates this outcome to a large number of women. Atypia is a diagnostic classification with considerable variation among practicing pathologists. One study of 115 U.S. pathologists reported that study pathologists agreed with an expert consensus diagnosis of atypia only 48% of the time.[16] Variability of Pathologists' Diagnoses on the Interpretation of Breast Biopsy Specimens The pathologist's diagnosis of breast tissue ranges from benign without atypia, to atypia, to DCIS, to invasive breast cancer. The incidence of atypia and DCIS breast lesions has increased over the past three decades as a result of widespread mammography screening, although atypia is generally mammographically occult.[17,18] Misclassification of breast lesions may contribute to either overtreatment or undertreatment of lesions identified during breast screening. Studies have demonstrated challenges encountered by pathologists on agreeing about the diagnoses of breast tissue, especially atypia and DCIS.[16,19,20,21,22,23] The largest study on this topic, the B-Path study, included 115 practicing U.S. pathologists who interpreted a single-breast biopsy slide per case and compared their interpretations with an expert consensus-derived reference diagnosis.[16] While the overall agreement between the individual pathologists' interpretations and the expert reference diagnoses was highest for invasive carcinoma, markedly lower levels of concordance were noted for DCIS and atypia.[16] As the B-Path study included higher proportions of cases of atypia and DCIS than typically seen in clinical practice, the authors expanded their work by applying Bayes' theorem to estimate how diagnostic variability affects accuracy from the perspective of a U.S. woman aged 50 to 59 years having a breast biopsy.[19] At the U.S. population level, it is estimated that 92.3% (confidence interval [CI], 91.4%-93.1%) of breast biopsy diagnoses would be verified by an expert reference consensus diagnosis, with 4.6% (CI, 3.9%-5.3%) of initial breast biopsies estimated to be overinterpreted and 3.2% (CI, 2.7%-3.6%) underinterpreted. Figure 1 shows the predicted outcomes per 100 breast biopsies, overall and by diagnostic category. 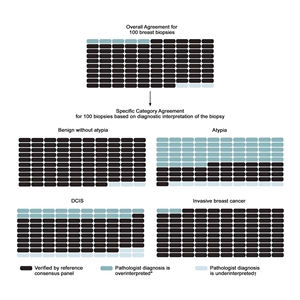
Figure 1. Predicted outcomes per 100 breast biopsies, overall and by diagnostic category. From Annals of Internal Medicine, Elmore JG, Nelson HD, Pepe MS, Longton GM, Tosteson AN, Geller B, Onega T, Carney PA, Jackson SL, Allison KH, Weaver DL, Variability in Pathologists' Interpretations of Individual Breast Biopsy Slides: A Population Perspective, Volume 164, Issue 10, Pages 649-55, Copyright © 2016 American College of Physicians. All Rights Reserved. Reprinted with the permission of American College of Physicians, Inc.
To address the high rates of discordance in breast tissue diagnosis, laboratory policies that require second opinions are becoming more common. A national survey of 252 breast pathologists participating in the B-Path study found that 65% of respondents reported having a laboratory policy that requires second opinions for all cases initially diagnosed as invasive disease. Additionally, 56% of respondents reported policies that require second opinions for initial diagnoses of DCIS, while 36% of respondents reported mandatory second opinion policies for cases initially diagnosed as atypical ductal hyperplasia.[24] In this same survey, pathologists overwhelmingly agreed that second opinions improved diagnostic accuracy (96%). A simulation study that used B-Path study data evaluated 12 strategies for obtaining second opinions to improve interpretation of breast histopathology.[25] Accuracy improved significantly with all second opinion strategies, except for the strategy limiting second opinions only to cases of invasive cancer. Accuracy improved regardless of the pathologists' confidence in their diagnosis or their level of experience. While the second opinions improved accuracy, they did not completely eliminate diagnostic variability, especially in the challenging case of breast atypia. References:
-
White RR, Halperin TJ, Olson JA Jr, et al.: Impact of core-needle breast biopsy on the surgical management of mammographic abnormalities. Ann Surg 233 (6): 769-77, 2001.
-
Allegra CJ, Aberle DR, Ganschow P, et al.: National Institutes of Health State-of-the-Science Conference statement: Diagnosis and Management of Ductal Carcinoma In Situ September 22-24, 2009. J Natl Cancer Inst 102 (3): 161-9, 2010.
-
American Cancer Society: Cancer Facts and Figures 2017. Atlanta, Ga: American Cancer Society, 2017. Available online. Last accessed May 25, 2017.
-
Virnig BA, Tuttle TM, Shamliyan T, et al.: Ductal carcinoma in situ of the breast: a systematic review of incidence, treatment, and outcomes. J Natl Cancer Inst 102 (3): 170-8, 2010.
-
Miller AB, To T, Baines CJ, et al.: Canadian National Breast Screening Study-2: 13-year results of a randomized trial in women aged 50-59 years. J Natl Cancer Inst 92 (18): 1490-9, 2000.
-
Page DL, Dupont WD, Rogers LW, et al.: Intraductal carcinoma of the breast: follow-up after biopsy only. Cancer 49 (4): 751-8, 1982.
-
Page DL, Dupont WD, Rogers LW, et al.: Continued local recurrence of carcinoma 15-25 years after a diagnosis of low grade ductal carcinoma in situ of the breast treated only by biopsy. Cancer 76 (7): 1197-200, 1995.
-
Fisher B, Dignam J, Wolmark N, et al.: Lumpectomy and radiation therapy for the treatment of intraductal breast cancer: findings from National Surgical Adjuvant Breast and Bowel Project B-17. J Clin Oncol 16 (2): 441-52, 1998.
-
Ernster VL, Barclay J, Kerlikowske K, et al.: Mortality among women with ductal carcinoma in situ of the breast in the population-based surveillance, epidemiology and end results program. Arch Intern Med 160 (7): 953-8, 2000.
-
Silverstein MJ: The University of Southern California/Van Nuys prognostic index for ductal carcinoma in situ of the breast. Am J Surg 186 (4): 337-43, 2003.
-
Fisher B, Dignam J, Wolmark N, et al.: Tamoxifen in treatment of intraductal breast cancer: National Surgical Adjuvant Breast and Bowel Project B-24 randomised controlled trial. Lancet 353 (9169): 1993-2000, 1999.
-
Weaver DL, Rosenberg RD, Barlow WE, et al.: Pathologic findings from the Breast Cancer Surveillance Consortium: population-based outcomes in women undergoing biopsy after screening mammography. Cancer 106 (4): 732-42, 2006.
-
Rubin E, Visscher DW, Alexander RW, et al.: Proliferative disease and atypia in biopsies performed for nonpalpable lesions detected mammographically. Cancer 61 (10): 2077-82, 1988.
-
Silverstein MJ, Recht A, Lagios MD, et al.: Special report: Consensus conference III. Image-detected breast cancer: state-of-the-art diagnosis and treatment. J Am Coll Surg 209 (4): 504-20, 2009.
-
Silverstein M: Where's the outrage? J Am Coll Surg 208 (1): 78-9, 2009.
-
Elmore JG, Longton GM, Carney PA, et al.: Diagnostic concordance among pathologists interpreting breast biopsy specimens. JAMA 313 (11): 1122-32, 2015.
-
Bleyer A, Welch HG: Effect of three decades of screening mammography on breast-cancer incidence. N Engl J Med 367 (21): 1998-2005, 2012.
-
Hall FM: Identification, biopsy, and treatment of poorly understood premalignant, in situ, and indolent low-grade cancers: are we becoming victims of our own success? Radiology 254 (3): 655-9, 2010.
-
Elmore JG, Nelson HD, Pepe MS, et al.: Variability in Pathologists' Interpretations of Individual Breast Biopsy Slides: A Population Perspective. Ann Intern Med 164 (10): 649-55, 2016.
-
Rosai J: Borderline epithelial lesions of the breast. Am J Surg Pathol 15 (3): 209-21, 1991.
-
Schnitt SJ, Connolly JL, Tavassoli FA, et al.: Interobserver reproducibility in the diagnosis of ductal proliferative breast lesions using standardized criteria. Am J Surg Pathol 16 (12): 1133-43, 1992.
-
Wells WA, Carney PA, Eliassen MS, et al.: Statewide study of diagnostic agreement in breast pathology. J Natl Cancer Inst 90 (2): 142-5, 1998.
-
Della Mea V, Puglisi F, Bonzanini M, et al.: Fine-needle aspiration cytology of the breast: a preliminary report on telepathology through Internet multimedia electronic mail. Mod Pathol 10 (6): 636-41, 1997.
-
Geller BM, Nelson HD, Carney PA, et al.: Second opinion in breast pathology: policy, practice and perception. J Clin Pathol 67 (11): 955-60, 2014.
-
Elmore JG, Tosteson AN, Pepe MS, et al.: Evaluation of 12 strategies for obtaining second opinions to improve interpretation of breast histopathology: simulation study. BMJ 353: i3069, 2016.
Breast Cancer Screening ConceptsBias Numerous uncontrolled trials and retrospective series have documented the ability of mammography to diagnose small, early-stage breast cancers, which have a favorable clinical course.[1] Although several trials also show better cancer-related survival in screened women versus nonscreened women, a number of important biases may explain that finding: - Lead-time bias: Survival time for a cancer found mammographically includes the time between detection and the time when the cancer would have been detected because of clinical symptoms, but this time is not included in the survival time of cancers found because of symptoms.
- Length bias: Mammography detects a cancer while it is preclinical, and preclinical durations vary. Cancers with longer preclinical durations are, by definition, present during more opportunities for discovery and therefore are more likely to be detected by screening; these cancers tend to be slow growing and to have better prognoses, irrespective of screening.
- Overdiagnosis bias: An extreme form of length bias; screening may find cancers that are very slow growing and would never have become manifest clinically in the woman's lifetime.
- Healthy volunteer bias: The screened population may be the healthiest and/or the most health-conscious women in the general population.
Because the extent of these biases is never clear in any particular study, the gold standard used by most groups to assess the benefits of screening is the randomized controlled trial (RCT) with cause-specific mortality as the endpoint. RCTs with cause-specific mortality as the endpoint avoid lead/length/overdiagnosis bias. (Refer to the PDQ summary on Cancer Screening Overview for more information.) Assessment of Performance and Accuracy Performance benchmarks for screening mammography in the United States are described on the Breast Cancer Surveillance Consortium (BCSC) website. Sensitivity The sensitivity of mammography is the percentage of breast cancers detected in a given population, when breast cancer is present. Sensitivity depends on tumor size, conspicuity, hormone sensitivity, breast tissue density, patient age, timing within the menstrual cycle, overall image quality, and interpretive skill of the radiologist. Overall sensitivity is approximately 79% but is lower in younger women and in those with dense breast tissue (see the BCSC website).[2,3,4] According to the Physician's Insurance Association of America (PIAA), delay in diagnosis of breast cancer and false-negative mammogram interpretations are a common cause of medical malpractice litigation. PIAA data from 2001 through 2011 note that breast cancer claims had the largest total indemnity payment and that diagnostic errors ranked as the top alleged error associated with breast cancer.[5] Specificity and false-positive rate The specificity of mammography is the likelihood of the test being normal when cancer is absent, whereas the false-positive rate is the likelihood of the test being abnormal when cancer is absent. If specificity is low, many false-positive examinations result in unnecessary follow-up examinations and procedures. (Refer to the subsection on Harms in the Screening With Mammography section of the Overview section of this summary for more information.) Interval cancers Interval cancers are cancers that are diagnosed in the interval after a normal screening examination and before the subsequent screen. Some of these cancers were present at the time of mammography (false negatives), and others grew rapidly in the interval between mammography and detection. As a general rule, interval cancers have characteristics of rapid growth [6,7] and are frequently of advanced stage at the time of discovery/diagnosis.[8] A study that used data from the Nova Scotia Breast Screening Program identified 342 interval breast cancers in the context of 302,234 screening exams. The authors classified the 342 into the categories of missed cancers (false-negative on the previous screen) and true interval cancers (cancers not detectable at the previous screening exam). For women aged 40 to 49 years, the annual rate of missed cancers per 1,000 women screened was 0.45; the rate for true interval cancers was 0.93. For women aged 50 to 69 years, the rate of missed cancers per 1,000 women screened was 0.90; the rate for true interval cancers was 3.15.[9] One study of 576 women with interval cancers reported that interval cancers are more prevalent in women aged 40 to 49 years. Interval cancers appearing within 12 months of a negative screening mammogram appear to be related to decreased mammographic sensitivity, attributable to greater breast density in 68% of cases. Those appearing within a 24-month interval appear to be related both to decreased mammographic sensitivity caused by greater breast density in 37.6% of cases and to rapid tumor growth in 30.6% of cases.[10] Another study that compared the characteristics of 279 screen-detected cancers with those of 150 interval cancers found that interval cancers were much more likely to occur in women younger than 50 years and to be of mucinous or lobular histology; or to have high histologic grade, high proliferative activity, or relatively benign features mammographically; and/or to lack calcifications. Screen-detected cancers were more likely to have tubular histology; to be smaller, low stage, and hormone sensitive; and to have a major component of ductal carcinoma in situ.[6] References:
-
Moody-Ayers SY, Wells CK, Feinstein AR: "Benign" tumors and "early detection" in mammography-screened patients of a natural cohort with breast cancer. Arch Intern Med 160 (8): 1109-15, 2000.
-
Carney PA, Miglioretti DL, Yankaskas BC, et al.: Individual and combined effects of age, breast density, and hormone replacement therapy use on the accuracy of screening mammography. Ann Intern Med 138 (3): 168-75, 2003.
-
Rosenberg RD, Hunt WC, Williamson MR, et al.: Effects of age, breast density, ethnicity, and estrogen replacement therapy on screening mammographic sensitivity and cancer stage at diagnosis: review of 183,134 screening mammograms in Albuquerque, New Mexico. Radiology 209 (2): 511-8, 1998.
-
Kerlikowske K, Grady D, Barclay J, et al.: Likelihood ratios for modern screening mammography. Risk of breast cancer based on age and mammographic interpretation. JAMA 276 (1): 39-43, 1996.
-
New PIAA Study Analyzes Diagnosis and Treatment of Breast Cancer [News Release]. Rockville, MD: Physician's Insurance Association of America, 2013. Available online. Last accessed March 7, 2017.
-
Porter PL, El-Bastawissi AY, Mandelson MT, et al.: Breast tumor characteristics as predictors of mammographic detection: comparison of interval- and screen-detected cancers. J Natl Cancer Inst 91 (23): 2020-8, 1999.
-
Hakama M, Holli K, Isola J, et al.: Aggressiveness of screen-detected breast cancers. Lancet 345 (8944): 221-4, 1995.
-
Tabár L, Faberberg G, Day NE, et al.: What is the optimum interval between mammographic screening examinations? An analysis based on the latest results of the Swedish two-county breast cancer screening trial. Br J Cancer 55 (5): 547-51, 1987.
-
Payne JI, Caines JS, Gallant J, et al.: A review of interval breast cancers diagnosed among participants of the Nova Scotia Breast Screening Program. Radiology 266 (1): 96-103, 2013.
-
Buist DS, Porter PL, Lehman C, et al.: Factors contributing to mammography failure in women aged 40-49 years. J Natl Cancer Inst 96 (19): 1432-40, 2004.
Breast Cancer Screening Imaging ModalitiesMammography Description and Background Mammography utilizes ionizing radiation to image breast tissue. The examination is performed by compressing the breast firmly between two plates. Such compression spreads out overlapping tissues and reduces the amount of radiation needed to image the breast. For routine screening in the United States, examinations are taken in both mediolateral oblique and craniocaudal projections. Both views should include breast tissue from the nipple to the pectoral muscle. Radiation exposure is 4 to 24 mSv per standard two-view screening examination. Two-view examinations are associated with a lower recall rate than are single-view examinations because they reduce concern about abnormalities due to superimposition of normal breast structures.[1] Two-view exams are also associated with lower interval cancer rates than are single-view exams.[2] Under the Mammography Quality Standards Act (MQSA) enacted by Congress in 1992, all U.S. facilities that perform mammography must be certified by the U.S. Food and Drug Administration (FDA) to ensure the use of standardized training for personnel and a standardized mammography technique utilizing a low radiation dose.[3] (Refer to the FDA's web page on Mammography Facility Surveys, Mammography Equipment Evaluations, and Medical Physicist Qualification Requirement under MQSA.) The 1998 MQSA Reauthorization Act requires that patients receive a written lay-language summary of mammography results. The following Breast Imaging Reporting and Data System (BI-RADS) categories are used for reporting mammographic results:[4] | 0: Incomplete-needs additional image evaluation and/or prior mammograms for comparison. | | 1: Negative. | | 2: Benign. | | 3: Probably benign. | | 4: Suspicious. | | 5: Highly suggestive of malignancy. | | 6: Known biopsy-proven malignancy. |
Most screening mammograms are typically interpreted as negative or benign (BI-RADS 1 or 2, respectively), with about 10% of women in the United States being asked to return for additional evaluation.[5] The percentage of women asked to return for additional evaluation varies not only by the underlying characteristics of each woman but also by mammography facility and radiologist. Extensive literature shows increasing rates of malignancy with BI-RADS assessment categories, with less than 1% risk for diagnosis of cancer within the next year after a BI-RADS 1 or 2 assessment, 2% risk for diagnosis of cancer within the next year after a BI-RADS 3 assessment, and 95% risk for diagnosis of cancer within the next year after a BI-RADS 5 assessment. A BI-RADS 4 can optionally be subdivided into categories 4a, low suspicion (>2% to 10% risk of malignancy); 4b, moderate suspicion (>10% to 50% risk of malignancy); and 4c, high suspicion (>50% to <95% risk of malignancy).[6] Digital Mammography Digital mammography is more expensive than screen-film mammography (SFM) but is more amenable to data storage and sharing. The net impact of screening with digital mammography versus film mammography, in terms of health outcomes and the net difference in rates of overdiagnosis, is unknown. Performance of both SFM and digital mammography for measures such as cancer detection rate, sensitivity, specificity, and positive predictive value (PPV) have been compared directly in several trials, and the trials yielded similar results. A large cohort of women (n = 42,760) who underwent both digital and film mammography was evaluated at 33 U.S. centers in the Digital Mammographic Imaging Screening Trial (DMIST). No differences in breast cancer detection were observed (area under the curve [AUC] of 0.78 +/- 0.02 for digital and AUC of 0.74 +/- 0.02 for film; P = .18). Digital mammography was better at cancer detection in women younger than 50 years (AUC of 0.84 +/- 0.03 for digital; AUC of 0.69 +/- 0.05 for film; P = .002).[7] A second DMIST report found that film mammography had a higher AUC in women aged 65 years and older (AUC 0.88 for film; AUC 0.70 for digital; P = .025); however, this finding was not statistically significant when multiple comparisons were considered.[8] In a large U.S. cohort study,[9] sensitivity for women younger than 50 years was 75.7% (95% CI, 71.7-79.3) for film mammography and 82.4% (95% CI, 76.3-87.5) for digital mammography; specificity was 89.7% (95% CI, 89.6-89.8) for film mammography and 88.0% (95% CI, 88.2-87.8) for digital mammography. A comparison of the findings from 1.5 million digital mammography screens and 4.5 million screen-film mammogram (SFM) screens that were performed in the Netherlands from 2004 to 2010 indicated higher recall and detection rates for the digital mammography screens.[10] Among radiologists who read both digital and SFM exams (n = 1.5 million), the recall rates were 2.0% for digital mammography (95% CI, 2.0-2.1) versus 1.6% for SFM (95% CI, 1.6-1.6); the detection rates were 5.9 per 1,000 (95% CI, 5.7-6.0) for digital mammography and 5.1 per 1,000 (95% CI, 5.0-5.2) for SFM. The PPV was statistically significantly lower in the digital mammography group (PPV, 31.2%; 95% CI, 30.6-31.7) than in the screen-film group (PPV, 34.4%; 95% CI, 33.8%-35.0%). For women aged 49 to 54 years, the recall rates for digital screens versus film screens were 2.7% versus 2.0%, respectively; the detection rates were 5.1 versus 4.0 per 1,000 screens, respectively; and the PPV was 21.4% and 22.1%, respectively. For women aged 55 to 74 years, the recall rates for digital screens versus film screens were 1.7% versus 1.4%, respectively; the detection rates were 6.2 versus 5.6 per 1,000 screens, respectively; and the PPV was 35.7% versus 40.1%, respectively.[10] A meta-analysis [11] of 10 studies, including the DMIST [7,8] and the aforementioned U.S. cohort study,[9] compared digital mammography with film mammography in 82,573 women who underwent both types of the exam. In a random-effects model, there was no statistically significant difference in cancer detection between the two types of mammography (AUC of 0.92 for film and AUC of 0.91 for digital). For women younger than 50 years, all studies found that sensitivity was higher for digital mammography but that specificity was either the same or higher for film mammography. The meta-analysis found no other differences based on age. Computed radiography (CR) utilizes a cassette-based removable detector and external reading device to generate a digital image. A large concurrent cohort study compared 254,758 full-field digital mammography (FFDM) screens with 487,334 SFM screens and 74,190 CR screens.[12] Again, the cancer detection rate was not different between FFDM (4.9 per 1,000) and SFM (4.8 per 1,000), although the recall rate was higher for FFDM. Importantly, cancer detection was lower for CR at 3.4 per 1,000, adjusted odds ratio (OR) 0.79 (95% CI, 0.68-0.93). Two prior studies of noncontemporaneous cohorts showed no difference between CR and SFM or higher cancer-detection rate from CR.[13,14] Computer-Aided Detection (CAD) CAD systems are designed to help radiologists read mammograms by highlighting suspicious regions such as clustered microcalcifications and masses.[15] Generally, CAD systems increase sensitivity and decrease specificity [16] and increase detection of ductal carcinoma in situ (DCIS).[17] Several CAD systems are in use. One large population-based study, comparing recall rates and breast cancer detection rates before and after the introduction of CAD systems found no change in either rate.[15,18] Another large study noted an increase in recall rate and increased DCIS detection but no improvement in invasive cancer detection rate.[17,19] A study designed to address the limitation of previous studies by using a large database and digital (rather than film screen) mammography in women aged 40 to 89 years (rather than primarily older women) found no evidence that CAD improves screening mammography performance for four outcomes: sensitivity, specificity, screen-detected cancers (DCIS and invasive), and detection of interval cancers. In this study, CAD did detect higher rates of DCIS.[20] Population-Based Evaluation of Digital Mammography and CAD Using a Surveillance, Epidemiology, and End Results-Medicare linked database, the use of new screening mammography modalities by more than 270,000 women aged 65 years and older in two time periods, 2001 to 2002 and 2008 to 2009, was examined. Digital mammography increased from 2% to 30%, CAD increased from 3% to 33%, and spending increased from $660 million to $962 million. There was no difference in detection rates of early-stage (DCIS or stage I) or late-stage (stage IV) tumors.[21] Tomosynthesis Tomosynthesis, or 3-dimensional (3-D) mammography, is similar to standard 2-D mammography in how the examination is performed: the breasts are compressed in the same positions as for mammography, and the examination uses x-rays to create the image. In tomosynthesis, multiple short-exposure x-rays are obtained at different angles as the x-ray tube moves over the breast. This process takes a few seconds longer than a standard mammogram. Individual images are then reconstructed into a series of thin slices that can be viewed individually or like a movie. Cancers and other abnormalities are detected because of differences in density and shape compared with surrounding tissue, with some cancers and other findings causing architectural distortion. Overlapping tissues can be more easily recognized accurately as normal with tomosynthesis, and some cancers are better seen than on standard mammography. In some centers, tomosynthesis-guided biopsy may be available because some cancers seen only on tomosynthesis cannot be found with ultrasound. The combination of 2-D and 3-D mammography has been reported to be more accurate than 2-D mammography alone, with respect to both improved detection of breast cancer (averaging added yield of 1.3/1,000, similar to CAD) and, importantly, reduction in recall rates. On average, 1.8% fewer women will be recalled for extra testing when tomosynthesis is performed in addition to standard 2-D digital mammography for screening. More than 80% of the cancers detected only with tomosynthesis are invasive and node negative.[22,23] In particular, tomosynthesis depicts architectural distortion better than standard digital mammography; in one series of 26 cases of architectural distortion in women who had both 2-D and 3-D mammography,[24] 19 (73%) were seen only on tomosynthesis, and 4 (21%) of those 19 were malignant. When tomosynthesis is performed in combination with 2-D mammography, the resulting radiation exposure to the patient is essentially doubled. This is expected to result in another 1.3 fatal cancers per 100,000 women screened at age 40 years (fewer with increasing age), compared with another 130 cancers detected (see Table 1). The performance of tomosynthesis in isolation (with synthetic 2-D mammograms created) has not been adequately validated in practice, with only one reader study and one prospective clinical trial undertaken to date.[25] The effect of annual tomosynthesis on breast cancer mortality has not been tested in a prospective clinical trial. Tomosynthesis in the diagnostic setting (specifically, evaluation of mammographic abnormalities) has been shown to be at least as effective as spot compression views for workup of noncalcified abnormalities, including asymmetries and distortions.[26,27] Tomosynthesis is not worse than standard 2-D mammography at allowing suspicious microcalcifications to be identified,[28] but magnification views are typically still needed to characterize suspicious calcifications. The use of tomosynthesis in both screening and diagnosis may decrease the need for ultrasound and other additional testing (see Table 1). At this time, there are no data on the association of tomosynthesis and overall mortality reduction. Table 1. Summary of Key Performance Measures for Screening with Tomosynthesis| Study | [22] | [23] | [29] | [30] | [31] | Overall |
|---|
| CDR = cancer detection rate; DBT = digital breast tomosynthesis, also known as 3-D mammography; FFDM = full field digital mammography, also known as standard 2-D mammography; no. = number. | | Study Design | Prospective; each patient had both exams | Prospective; each patient had both exams | Historical control with 2-D only | Historical control with 2-D only | Historical control with 2-D only | | | No. of DBT | 12,631 | 7,292 | 9,499 | 173,663 | 23,149 | 226,234 | | No. of FFDM | 12,631 | 7,292 | 13,856 | 281,187 | 54,684 | 365,293 | | CDR 3-D+2-D | 8.0/1,000 | 8.1/1,000 | 5.37/1,000 | 5.4/1,000 | 6.3/1,000 | | | CDR FFDM (2-D) Alone | 6.1/1,000 | 5.3/1,000 | 4.04/1,000 | 4.2/1,000 | 4.9/1,000 | | | Difference (No. of Women) | +1.9/1,000 (24) | +2.7/1,000 (20) | +1.3/1,000 (12) | +1.2/1,000 (208) | +1.4/1,000 (32) | +1.3/1,000 (296) | | P -Value (Detection Rate) | .001 | < .0001 | 0.18 | < .001 | .035 | | | Absolute Recall Rate Difference | -0.8% | -2.0% | -3.2% | -1.6% | -2.6% | -1.8% | | P -Value (Recall Rate) | < .001 | < .0001 | < .001 | < .001 | > .0001 | | Ultrasonography The primary role of ultrasound is the diagnostic evaluation of palpable or mammographically identified masses, rather than serving as a primary screening modality. A review of the literature and expert opinion by the European Group for Breast Cancer Screening concluded that "there is little evidence to support the use of ultrasound in population breast cancer screening at any age."[32] In the setting of normal mammography and ultrasonography, less than 3% of women who have a lump will ultimately be found to have breast cancer.[33,34,35,36] Magnetic Resonance Imaging Breast magnetic resonance imaging (MRI) may be used in women for diagnostic evaluation, including evaluating the integrity of silicone breast implants, assessing palpable masses following surgery or radiation therapy, detecting mammographically and sonographically occult breast cancer in patients with axillary nodal metastasis, and preoperative planning for some patients with known breast cancer. There is no ionizing radiation exposure with this procedure. MRI has been promoted as a screening test for breast cancer among women at elevated risk of breast cancer based on BRCA1/2 mutation carriers, a strong family history of breast cancer, or several genetic syndromes such as Li-Fraumeni or Cowden disease.[37,38,39] Breast MRI is more sensitive but less specific than screening mammography [40,41] and is more expensive. Thermography Using infrared imaging techniques, thermography of the breast identifies temperature changes in the skin as an indicator of an underlying tumor, displaying these changes in color patterns. Thermographic devices have been approved by the FDA under the 510(k) process, which does not require evidence of clinical effectiveness. There have been no randomized trials of thermography to evaluate the impact on breast cancer mortality or the ability to detect breast cancer. Small cohort studies do not suggest any additional benefit for the use of thermography as an adjunct modality for breast cancer screening.[42,43] Benefit of Screening Randomized controlled trials Randomized controlled trials (RCTs), with participation by nearly half-a-million women from four countries, examined the breast cancer mortality rates of women who were offered regular screening. One trial, the Canadian National Breast Screening Study (NBSS)-2, compared mammogram plus clinical breast examination (CBE) with CBE alone; the other eight trials compared screening mammogram with or without CBE to a control consisting of usual care. The trials differed in design, recruitment of participants, interventions (both screening and treatment), management of the control group, compliance with assignment to screening and control groups, and analysis of outcomes. Some trials used individual randomization, while others used cluster randomization in which cohorts were identified and then offered screening; one trial used nonrandomized allocation by day of birth in any given month. Cluster randomization sometimes led to imbalances between the intervention and control groups. Age differences have been identified in several trials, although the differences were probably too small to have a major effect on the trial outcome.[44] In the Edinburgh Trial, socioeconomic status, which correlates with the risk of breast cancer mortality, differed markedly between the intervention and control groups, so it is difficult, if not impossible, to interpret the results. Breast cancer mortality is the major outcome parameter for each of these trials, so the methods used to determine cause of death are critically important. Efforts to reduce bias in the attribution of mortality cause have been made, including the use of a blinded monitoring committee (New York) and a linkage to independent data sources, such as national mortality registries (Swedish trials). Unfortunately, these attempts could not ensure a lack of knowledge of women's assignments to screening or control arms. Evidence of possible misclassification of breast cancer deaths in the Two-County Trial with possible bias in favor of screening has been analyzed.[45] There were also differences in the methodology used to analyze the results of these trials. Four of the five Swedish trials were designed to include a single screening mammogram in the control group, timed to correspond with the end of the series of screening mammograms in the study group. The initial analysis of these trials used an evaluation analysis, tallying only the breast cancer deaths that occurred in women whose cancer was discovered at or before the last study mammogram. In some of the trials a delay occurred in the performance of the end-of-study mammogram, resulting in more time for members of the control group to develop or be diagnosed with breast cancer. Other trials used a follow-up analysis, which counts all deaths attributed to breast cancer, regardless of the time of diagnosis. This type of analysis was used in a meta-analysis of four of the five Swedish trials in response to concerns about the evaluation analyses.[45] The accessibility of the data for international audits and verification also varies, with formal audit having been undertaken only in the Canadian trials. Other trials have been audited to varying degrees, usually with less rigor.[46] All of these studies are designed to study breast cancer mortality rather than all-cause mortality because of the infrequency of breast cancer deaths relative to the total number of deaths. When all-cause mortality in these trials was examined retrospectively, only the Edinburgh Trial showed a significant difference, which could be attributed to socioeconomic differences. The meta-analysis (follow-up methods) of the four Swedish trials also showed a small but significant improvement of all-cause mortality. Refer to the Appendix of Randomized Controlled Trials section of this summary for a detailed description of the trials. Summary of RCTs Screening for breast cancer does not affect overall mortality, and the absolute benefit for breast cancer mortality is small. A way to view the potential benefit of breast cancer screening is to estimate the number of lives extended because of early breast cancer detection.[47,48] One author estimated the outcomes of 10,000 women aged 50 to 70 years who undergo a single screen.[49] Mammograms will be normal (true negatives and false negatives) in 9,500 women. Of the 500 abnormal screens, 466 to 479 will be false positives, and 100 to 200 of these women will undergo invasive procedures. The remaining 21 to 34 abnormal screens will be true positives, indicating breast cancer. Some of these women will die of breast cancer in spite of mammographic detection and optimal therapy, and some may live long enough to die of other causes even if the cancer had not been screen detected. The number of extended lives attributable to mammographic detection is between two and six. Another expression of this analysis is that one life may be extended per 1,700 to 5,000 women screened and followed for 15 years. The same analysis for 10,000 women aged 40 to 49 years, assuming the same 500 abnormal examinations, results in an estimate that 488 of these will be false positives, and 12 will be breast cancer. Of these 12, there will probably be only one or two lives extended. Thus, for women aged 40 to 49 years, it is estimated that one or two lives may be extended per 5,000 to 10,000 mammograms. While the numbers discussed above are from a single mammography exam, women undergo screening throughout their lifetimes, which can include 20 to 30 years of screening activity. A meta-analysis of RCTs conducted for the U.S. Preventive Services Task Force in 2009 (including the AGE Trial) found that the number needed to invite to screen for 10 years to avoid or delay one death from breast cancer was 1,904 for women in their 40s, 1,339 for women in their 50s, and 377 for women in their 60s.[50] A 2009 combined analysis by six Cancer Intervention and Surveillance Modeling Network modeling groups found that screening every 2 years maintained an average of 81% of the benefit of annual screening with almost one-half of the false-positive results. Screening biennially from age 50 to 69 years achieved a median 16.5% reduction in breast cancer deaths versus no screening. Initiating biennial screening at age 40 years (vs. age 50 years) reduced breast cancer mortality by an additional 3%, consumed more resources, and yielded more false-positive results.[51] There are several problems with using these RCTs alone to estimate the magnitude of breast cancer mortality reduction from a long-term program of breast cancer screening in the present. These problems include the following: - Changes in mammography since the RCTs.
- Changes in breast cancer awareness among women since the RCTs.
- Changes in the distribution of risk factors in the population (including age at menarche, age at first pregnancy, obesity, and use of postmenopausal hormone treatment) since the RCTs.
- Changes in breast cancer treatment since the RCTs.
- Difficulties with estimating long term effects of breast cancer screening from short-term RCTs.
Although there is no ideal answer to these problems, it is important to take into account well-conducted cohort and ecologic studies, in addition to RCTs, in the estimation of the magnitude of breast cancer mortality reduction resulting from current day screening.[52] It is also important to recognize that the harms of screening, especially false-positive results, are greater with a first screen and decrease with subsequent screens, for which there are previous images for comparison. Effectiveness of Population-Based Screening Programs Although the RCTs of screening have addressed the issue of screening efficacy (i.e., the extent to which screening reduces breast cancer mortality under the ideal conditions of an RCT), they do not provide information about the effectiveness of screening (i.e., the extent to which screening is reducing breast cancer mortality in the U.S. population). Studies that provide information about this issue include nonrandomized controlled studies of screened versus nonscreened populations, case-control studies of screening in real communities, and modeling studies that examine the impact of screening on large populations. An important issue in all of these studies is the extent to which they can control for additional effects on breast cancer mortality such as improved treatment and heightened awareness of breast cancer in the community. Three population-based, observational studies from Sweden compared breast cancer mortality in the presence and absence of screening mammography programs. One study compared two adjacent time periods in 7 of the 25 counties in Sweden and concluded a statistically significant breast cancer mortality reduction of 18% to 32% attributable to screening.[53] The most important bias in this study is that the advent of screening in these counties occurred over a period during which dramatic improvements in the effectiveness of adjuvant breast cancer therapy were being made, changes which were not addressed by the study authors. The second study considered an 11-year period comparing seven counties with screening programs with five counties without them.[54] There was a trend in favor of screening, but again, the authors did not consider the effect of adjuvant therapy or differences in geography (urban vs. rural) that might affect treatment practices. In part to account for the effects of treatment, the third study was a detailed analysis by county and concluded little impact of screening.[55] These authors made the assumption that the annual decrease in mortality observed during the prescreening period would carry into the postscreening period, and any screening effect would result in an incremental decrease in mortality. Although no such incremental decrease in breast cancer mortality was observed after the introduction of screening, their assumption makes their conclusion weak. Comparisons across counties showed similar reductions in decreased breast cancer mortality regardless of when the counties' screening programs were initiated; however, the authors carried out no formal cross-county analyses. The interpretation of this ecologic analysis is limited by the following factors: - The analysis did not isolate incident breast cancer cases diagnosed before the introduction of breast cancer screening from the analysis of breast cancer deaths after the introduction of screening. These cases account for more than one-half of all deaths in a 10-year period after the introduction of screening.
- The analysis did not adjust for trends in increasing incidence (which put upward pressure on mortality rates, independent of screening).
- Unlike the observational studies,[53,54] the third study [55] did not measure exposure to screening.
- The analysis did not compensate for deaths avoided after age 70 years resulting from breast cancer detection by mammography before age 70 years.
- The analysis did not adjust for opportunistic screening that occurred in some counties.
- The analysis did not account for the duration of time that is required to implement screening in the counties, which varied (i.e., screening is not fully effective the day after screening becomes policy and counties varied in the pace of screening implementation).
In Nijmegen, the Netherlands, where a population-based screening program was undertaken in 1975, a case-cohort study showed that screened women have decreased mortality (OR, 0.48).[56] However, a subsequent study comparing Nijmegen breast cancer mortality rates with neighboring Arnhem in the Netherlands, which had no screening program, showed no difference in breast cancer mortality.[57] A community-based case-control study of screening as practiced in excellent U.S. health care systems between 1983 and 1998 found no association between previous screening and reduced breast cancer mortality. Mammography screening rates, however, were generally low.[58] The association among women at increased risk because of a family history of breast cancer or a previous breast biopsy (OR, 0.74; 95% CI, 0.50-1.03) was stronger than that among women at average risk (OR, 0.96; 95% CI, 0.80-1.14), but the difference was not statistically significant (P = .17).[58] A well-conducted ecologic study compared three pairs of neighboring European countries, matched on similarity in health care systems and population structure, one of which had started a national screening program some years earlier than the others. The investigators found that each country had experienced a reduction in breast cancer mortality, with no difference between matched pairs that could be attributed to screening. The authors suggested that improvements in breast cancer treatment and/or health care organizations were more likely responsible for the reduction in mortality than was screening.[59] A systematic review of ecologic and large cohort studies published through March 2011 compared breast cancer mortality in large populations of women aged 50 to 69 years who started breast cancer screening at different times. Seventeen studies met inclusion criteria. All studies had methodological problems, including control group dissimilarities, insufficient adjustment for differences between areas in breast cancer risk and breast cancer treatment, and problems with similar measurement of breast cancer mortality between compared areas. There was great variation in results among the studies, with four studies finding a relative reduction in breast cancer mortality of 33% or more (with wide CIs) and five studies finding no reduction in breast cancer mortality. Because only a part of the overall reduction in breast cancer mortality could possibly be attributed to screening, the review concluded that any relative reduction in breast cancer mortality resulting from screening would likely be no more than 10%, less than predicted by the RCTs.[60] A U.S. ecologic analysis conducted between 1976 and 2008 examined the incidence of early-stage versus late-stage breast cancer for women aged 40 years and older. To find a screening effect, the authors compared the magnitude of increase in early-stage cancer with the magnitude of an expected decrease in late-stage cancer. Over the study period, the absolute increase in the incidence of early-stage cancer was 122 cancers per 100,000 women, while the absolute decrease in late-stage cancers was 8 cases per 100,000 women. After adjusting for changes in incidence resulting from hormone therapy and other undefined causes, the authors concluded that the screening effect on breast cancer mortality reduction (28% during this period) was small, and that overdiagnosis of breast cancer was likely between 22% and 31% of all diagnosed breast cancers. Most of the reduction in breast cancer mortality, the authors concluded, was probably because of improved treatment rather than screening. To make these adjustments, the authors made uncertain assumptions about the effects of other factors on incidence, and made no mention of the effects of changing treatment over time. Ecologic studies are difficult to interpret because of this type of potential uncontrolled confounding, as well as these types of unfair comparisons. However, this study largely agrees with some similar analyses from other countries (see studies discussed above).[61] A major limitation of this and other ecologic studies is the failure to account for actual exposure to screening. Most late-stage breast cancer occurs in women not exposed to screening. An analytic approach was used to approximate the magnitude of overdiagnosis and the contributions of screening versus treatment to breast cancer mortality reduction.[62] The shift in the size distribution of breast cancers in the United States from 1975 to 2012, an interval that spans the period from before the introduction of mammography to after its widespread dissemination, was investigated using Surveillance, Epidemiology, and End Results (SEER) data in women aged 40 years and older under the assumption that the rate of clinically meaningful breast cancer was stable over this period. There was an indication of the potential for screening to lower mortality reflected in a declining incidence of larger (≥ 2 cm) tumors. However, reduction in breast cancer case fatality was also documented, with the change for large tumors likely primarily caused by improvements in therapy. This decline in size-specific case fatality suggested that improved treatment was responsible for about two-thirds of the reduction in breast cancer mortality. 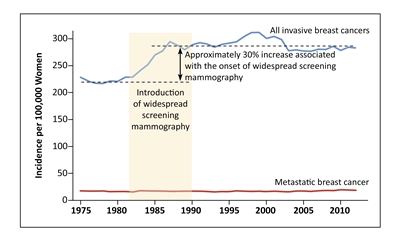
Figure 2. Screening mammography and increased incidence of invasive breast cancer. Shown are the incidences of overall invasive breast cancer and metastatic breast cancer among women 40 years of age or older at nine sites of the Surveillance, Epidemiology, and End Results (SEER) program, during the period from 1975 through 2012. From New England Journal of Medicine, Welch HG, Prorok PC, O'Malley AJ, Kramer BS, Breast-Cancer Tumor Size, Overdiagnosis, and Mammography Screening Effectiveness, Volume 375, Issue 15, Pages 1438-47, Copyright © 2016 Massachusetts Medical Society. Reprinted with permission from Massachusetts Medical Society.
A prospective cohort study of community-based screening programs in the United States found that annual compared with biennial screening mammography did not reduce the proportion of unfavorable breast cancers detected in women aged 50 to 74 years or in women aged 40 to 49 years who did not have extremely dense breasts. Women aged 40 to 49 years with extremely dense breasts did have a reduction in cancers larger than 2.0 cm (OR for biennial vs. annual screening, 2.39; 95% CI, 1.37-4.18).[63] Statistical Modeling of Breast Cancer Incidence and Mortality in the United States The optimal screening interval has been addressed by modelers. Modeling makes assumptions that may not be correct; however, the credibility of modeling is greater when the model produces overall results that are consistent with randomized trials overall and when the model is used to interpolate or extrapolate. For example, if a model's output agrees with RCT outcomes for annual screening, it has greater credibility in comparing the relative effectiveness of biennial versus annual screening. In 2000, the National Cancer Institute formed a consortium of modeling groups (Cancer Intervention and Surveillance Modeling [CISNET]) to address the relative contribution of screening and adjuvant therapy to the observed decline in breast cancer mortality in the United States.[64] (Refer to the Randomized controlled trials section of this summary for more information.) These models gave reductions in breast cancer mortality similar to those expected in the circumstances of the RCTs but updated to the use of modern adjuvant therapy. In 2009, CISNET modelers addressed several questions related to the harms and benefits of mammography, including comparing annual versus biennial screening.[51] The proportion of reduction in breast cancer mortality maintained in moving from annual to biennial screening for women aged 50 to 74 years ranged across the six models from 72% to 95%, with a median of 80%. References:
-
Sickles EA: Findings at mammographic screening on only one standard projection: outcomes analysis. Radiology 208 (2): 471-5, 1998.
-
Dibden A, Offman J, Parmar D, et al.: Reduction in interval cancer rates following the introduction of two-view mammography in the UK breast screening programme. Br J Cancer 110 (3): 560-4, 2014.
-
Lillie-Blanton M: Mammography Quality Standards Act : X-ray Quality Improved, Access Unaffected, but Impact on Health Outcomes Unknown: Testimony Before the Subcommittee on Health and the Environment, Committee on Commerce, House of Representatives. Washington, D.C.: Committee on Commerce, 1998. Available online. Last accessed April 27, 2017.
-
D'Orsi CJ, Sickles EA, Mendelson EB, et al.: ACR BI-RADS Atlas, Breast Imaging Reporting and Data System. 5th ed. Reston, Va: American College of Radiology, 2013. Also available online. Last accessed April 27, 2017.
-
Rosenberg RD, Yankaskas BC, Abraham LA, et al.: Performance benchmarks for screening mammography. Radiology 241 (1): 55-66, 2006.
-
Sickles EA, D'Orsi CJ, Bassett LW, et al.: ACR BI-RADS Mammography. In: D'Orsi CJ, Sickles EA, Mendelson EB, et al.: ACR BI-RADS Atlas, Breast Imaging Reporting and Data System. 5th ed. Reston, Va: American College of Radiology, 2013, pp 3-171. Also available online. Last accessed December 1, 2016.
-
Pisano ED, Gatsonis C, Hendrick E, et al.: Diagnostic performance of digital versus film mammography for breast-cancer screening. N Engl J Med 353 (17): 1773-83, 2005.
-
Pisano ED, Hendrick RE, Yaffe MJ, et al.: Diagnostic accuracy of digital versus film mammography: exploratory analysis of selected population subgroups in DMIST. Radiology 246 (2): 376-83, 2008.
-
Kerlikowske K, Hubbard RA, Miglioretti DL, et al.: Comparative effectiveness of digital versus film-screen mammography in community practice in the United States: a cohort study. Ann Intern Med 155 (8): 493-502, 2011.
-
van Luijt PA, Fracheboud J, Heijnsdijk EA, et al.: Nation-wide data on screening performance during the transition to digital mammography: observations in 6 million screens. Eur J Cancer 49 (16): 3517-25, 2013.
-
Souza FH, Wendland EM, Rosa MI, et al.: Is full-field digital mammography more accurate than screen-film mammography in overall population screening? A systematic review and meta-analysis. Breast 22 (3): 217-24, 2013.
-
Chiarelli AM, Edwards SA, Prummel MV, et al.: Digital compared with screen-film mammography: performance measures in concurrent cohorts within an organized breast screening program. Radiology 268 (3): 684-93, 2013.
-
Heddson B, Rönnow K, Olsson M, et al.: Digital versus screen-film mammography: a retrospective comparison in a population-based screening program. Eur J Radiol 64 (3): 419-25, 2007.
-
Lipasti S, Anttila A, Pamilo M: Mammographic findings of women recalled for diagnostic work-up in digital versus screen-film mammography in a population-based screening program. Acta Radiol 51 (5): 491-7, 2010.
-
Gur D, Sumkin JH, Rockette HE, et al.: Changes in breast cancer detection and mammography recall rates after the introduction of a computer-aided detection system. J Natl Cancer Inst 96 (3): 185-90, 2004.
-
Ciatto S, Del Turco MR, Risso G, et al.: Comparison of standard reading and computer aided detection (CAD) on a national proficiency test of screening mammography. Eur J Radiol 45 (2): 135-8, 2003.
-
Fenton JJ, Taplin SH, Carney PA, et al.: Influence of computer-aided detection on performance of screening mammography. N Engl J Med 356 (14): 1399-409, 2007.
-
Elmore JG, Carney PA: Computer-aided detection of breast cancer: has promise outstripped performance? J Natl Cancer Inst 96 (3): 162-3, 2004.
-
Fenton JJ, Xing G, Elmore JG, et al.: Short-term outcomes of screening mammography using computer-aided detection: a population-based study of medicare enrollees. Ann Intern Med 158 (8): 580-7, 2013.
-
Lehman CD, Wellman RD, Buist DS, et al.: Diagnostic Accuracy of Digital Screening Mammography With and Without Computer-Aided Detection. JAMA Intern Med 175 (11): 1828-37, 2015.
-
Killelea BK, Long JB, Chagpar AB, et al.: Evolution of breast cancer screening in the Medicare population: clinical and economic implications. J Natl Cancer Inst 106 (8): , 2014.
-
Skaane P, Bandos AI, Gullien R, et al.: Prospective trial comparing full-field digital mammography (FFDM) versus combined FFDM and tomosynthesis in a population-based screening programme using independent double reading with arbitration. Eur Radiol 23 (8): 2061-71, 2013.
-
Ciatto S, Houssami N, Bernardi D, et al.: Integration of 3D digital mammography with tomosynthesis for population breast-cancer screening (STORM): a prospective comparison study. Lancet Oncol 14 (7): 583-9, 2013.
-
Partyka L, Lourenco AP, Mainiero MB: Detection of mammographically occult architectural distortion on digital breast tomosynthesis screening: initial clinical experience. AJR Am J Roentgenol 203 (1): 216-22, 2014.
-
Skaane P, Bandos AI, Eben EB, et al.: Two-view digital breast tomosynthesis screening with synthetically reconstructed projection images: comparison with digital breast tomosynthesis with full-field digital mammographic images. Radiology 271 (3): 655-63, 2014.
-
Noroozian M, Hadjiiski L, Rahnama-Moghadam S, et al.: Digital breast tomosynthesis is comparable to mammographic spot views for mass characterization. Radiology 262 (1): 61-8, 2012.
-
Tagliafico A, Astengo D, Cavagnetto F, et al.: One-to-one comparison between digital spot compression view and digital breast tomosynthesis. Eur Radiol 22 (3): 539-44, 2012.
-
Rafferty EA, Park JM, Philpotts LE, et al.: Assessing radiologist performance using combined digital mammography and breast tomosynthesis compared with digital mammography alone: results of a multicenter, multireader trial. Radiology 266 (1): 104-13, 2013.
-
Rose SL, Tidwell AL, Bujnoch LJ, et al.: Implementation of breast tomosynthesis in a routine screening practice: an observational study. AJR Am J Roentgenol 200 (6): 1401-8, 2013.
-
Friedewald SM, Rafferty EA, Rose SL, et al.: Breast cancer screening using tomosynthesis in combination with digital mammography. JAMA 311 (24): 2499-507, 2014.
-
Greenberg JS, Javitt MC, Katzen J, et al.: Clinical performance metrics of 3D digital breast tomosynthesis compared with 2D digital mammography for breast cancer screening in community practice. AJR Am J Roentgenol 203 (3): 687-93, 2014.
-
Teh W, Wilson AR: The role of ultrasound in breast cancer screening. A consensus statement by the European Group for Breast Cancer Screening. Eur J Cancer 34 (4): 449-50, 1998.
-
Moy L, Slanetz PJ, Moore R, et al.: Specificity of mammography and US in the evaluation of a palpable abnormality: retrospective review. Radiology 225 (1): 176-81, 2002.
-
Houssami N, Irwig L, Simpson JM, et al.: Sydney Breast Imaging Accuracy Study: Comparative sensitivity and specificity of mammography and sonography in young women with symptoms. AJR Am J Roentgenol 180 (4): 935-40, 2003.
-
Georgian-Smith D, Taylor KJ, Madjar H, et al.: Sonography of palpable breast cancer. J Clin Ultrasound 28 (5): 211-6, 2000.
-
Dennis MA, Parker SH, Klaus AJ, et al.: Breast biopsy avoidance: the value of normal mammograms and normal sonograms in the setting of a palpable lump. Radiology 219 (1): 186-91, 2001.
-
Warner E, Plewes DB, Hill KA, et al.: Surveillance of BRCA1 and BRCA2 mutation carriers with magnetic resonance imaging, ultrasound, mammography, and clinical breast examination. JAMA 292 (11): 1317-25, 2004.
-
Kriege M, Brekelmans CT, Boetes C, et al.: Efficacy of MRI and mammography for breast-cancer screening in women with a familial or genetic predisposition. N Engl J Med 351 (5): 427-37, 2004.
-
Warner E, Hill K, Causer P, et al.: Prospective study of breast cancer incidence in women with a BRCA1 or BRCA2 mutation under surveillance with and without magnetic resonance imaging. J Clin Oncol 29 (13): 1664-9, 2011.
-
Lord SJ, Lei W, Craft P, et al.: A systematic review of the effectiveness of magnetic resonance imaging (MRI) as an addition to mammography and ultrasound in screening young women at high risk of breast cancer. Eur J Cancer 43 (13): 1905-17, 2007.
-
Lehman CD, Gatsonis C, Kuhl CK, et al.: MRI evaluation of the contralateral breast in women with recently diagnosed breast cancer. N Engl J Med 356 (13): 1295-303, 2007.
-
Wishart GC, Campisi M, Boswell M, et al.: The accuracy of digital infrared imaging for breast cancer detection in women undergoing breast biopsy. Eur J Surg Oncol 36 (6): 535-40, 2010.
-
Arora N, Martins D, Ruggerio D, et al.: Effectiveness of a noninvasive digital infrared thermal imaging system in the detection of breast cancer. Am J Surg 196 (4): 523-6, 2008.
-
Gøtzsche PC, Olsen O: Is screening for breast cancer with mammography justifiable? Lancet 355 (9198): 129-34, 2000.
-
Gøtzsche PC, Nielsen M: Screening for breast cancer with mammography. Cochrane Database Syst Rev (4): CD001877, 2006.
-
Nyström L, Andersson I, Bjurstam N, et al.: Long-term effects of mammography screening: updated overview of the Swedish randomised trials. Lancet 359 (9310): 909-19, 2002.
-
Kerlikowske K: Efficacy of screening mammography among women aged 40 to 49 years and 50 to 69 years: comparison of relative and absolute benefit. J Natl Cancer Inst Monogr (22): 79-86, 1997.
-
Glasziou PP, Woodward AJ, Mahon CM: Mammographic screening trials for women aged under 50. A quality assessment and meta-analysis. Med J Aust 162 (12): 625-9, 1995.
-
Harris R, Leininger L: Clinical strategies for breast cancer screening: weighing and using the evidence. Ann Intern Med 122 (7): 539-47, 1995.
-
Nelson HD, Tyne K, Naik A, et al.: Screening for breast cancer: an update for the U.S. Preventive Services Task Force. Ann Intern Med 151 (10): 727-37, W237-42, 2009.
-
Mandelblatt JS, Cronin KA, Bailey S, et al.: Effects of mammography screening under different screening schedules: model estimates of potential benefits and harms. Ann Intern Med 151 (10): 738-47, 2009.
-
Hanley JA, McGregor M, Liu Z, et al.: Measuring the mortality impact of breast cancer screening. Can J Public Health 104 (7): e437-42, 2013 Nov-Dec.
-
Duffy SW, Tabár L, Chen HH, et al.: The impact of organized mammography service screening on breast carcinoma mortality in seven Swedish counties. Cancer 95 (3): 458-69, 2002.
-
Jonsson H, Nyström L, Törnberg S, et al.: Service screening with mammography of women aged 50-69 years in Sweden: effects on mortality from breast cancer. J Med Screen 8 (3): 152-60, 2001.
-
Autier P, Koechlin A, Smans M, et al.: Mammography screening and breast cancer mortality in Sweden. J Natl Cancer Inst 104 (14): 1080-93, 2012.
-
Broeders MJ, Peer PG, Straatman H, et al.: Diverging breast cancer mortality rates in relation to screening? A comparison of Nijmegen to Arnhem and the Netherlands, 1969-1997. Int J Cancer 92 (2): 303-8, 2001.
-
Verbeek AL, Hendriks JH, Holland R, et al.: Reduction of breast cancer mortality through mass screening with modern mammography. First results of the Nijmegen project, 1975-1981. Lancet 1 (8388): 1222-4, 1984.
-
Elmore JG, Reisch LM, Barton MB, et al.: Efficacy of breast cancer screening in the community according to risk level. J Natl Cancer Inst 97 (14): 1035-43, 2005.
-
Autier P, Boniol M, Gavin A, et al.: Breast cancer mortality in neighbouring European countries with different levels of screening but similar access to treatment: trend analysis of WHO mortality database. BMJ 343: d4411, 2011.
-
Harris R, Yeatts J, Kinsinger L: Breast cancer screening for women ages 50 to 69 years a systematic review of observational evidence. Prev Med 53 (3): 108-14, 2011.
-
Bleyer A, Welch HG: Effect of three decades of screening mammography on breast-cancer incidence. N Engl J Med 367 (21): 1998-2005, 2012.
-
Welch HG, Prorok PC, O'Malley AJ, et al.: Breast-Cancer Tumor Size, Overdiagnosis, and Mammography Screening Effectiveness. N Engl J Med 375 (15): 1438-1447, 2016.
-
Kerlikowske K, Zhu W, Hubbard RA, et al.: Outcomes of screening mammography by frequency, breast density, and postmenopausal hormone therapy. JAMA Intern Med 173 (9): 807-16, 2013.
-
Berry DA, Cronin KA, Plevritis SK, et al.: Effect of screening and adjuvant therapy on mortality from breast cancer. N Engl J Med 353 (17): 1784-92, 2005.
Characteristics of Cancers Detected by Breast ImagingSeveral studies have shown that the method of cancer detection is a powerful predictor of patient outcome,[1] which is useful for prognostication and treatment decisions. All of the studies accounted for stage, nodal status, and tumor size. A 10-year follow-up study of 1,983 Finnish women with invasive breast cancer demonstrated that the method of cancer detection is an independent prognostic variable. When controlled for age, nodal status, and tumor size, screen-detected cancers had a lower risk of relapse and better overall survival. For women whose cancers were detected outside screening, the hazard ratio (HR) for death was 1.90 (95% confidence interval [CI], 1.15-3.11), even though they were more likely to receive adjuvant systemic therapy.[2] Similarly, an examination of the breast cancers found in three randomized screening trials (Health Insurance Plan, National Breast Screening Study [NBSS]-1, and NBSS-2) accounted for stage, nodal status, and tumor size and determined that patients whose cancer was found via screening have a more favorable prognosis. The relative risks for death were 1.53 (95% CI, 1.17-2.00) for interval and incident cancers, compared with screen-detected cancers; and 1.36 (95% CI, 1.10-1.68) for cancers in the control group, compared with screen-detected cancers.[3] A third study compared the outcomes of 5,604 English women with screen-detected cancers to those with symptomatic breast cancers diagnosed between 1998 and 2003. After controlling for tumor size, nodal status, grade, and patient age, researchers found that the women with screen-detected cancers fared better than their symptomatic counterparts. The HR for survival of the symptomatic women was 0.79 (95% CI, 0.63-0.99).[4] Thus, method of cancer detection is a powerful predictor of patient outcome,[2] which is useful for prognostication and treatment decisions. The findings of this study are also consistent with the evidence that some screen-detected cancers are low risk and represent overdiagnosis. References:
-
Sickles EA: Findings at mammographic screening on only one standard projection: outcomes analysis. Radiology 208 (2): 471-5, 1998.
-
Joensuu H, Lehtimäki T, Holli K, et al.: Risk for distant recurrence of breast cancer detected by mammography screening or other methods. JAMA 292 (9): 1064-73, 2004.
-
Shen Y, Yang Y, Inoue LY, et al.: Role of detection method in predicting breast cancer survival: analysis of randomized screening trials. J Natl Cancer Inst 97 (16): 1195-203, 2005.
-
Wishart GC, Greenberg DC, Britton PD, et al.: Screen-detected vs symptomatic breast cancer: is improved survival due to stage migration alone? Br J Cancer 98 (11): 1741-4, 2008.
Variables Associated with AccuracyPatient Characteristics Several characteristics of women being screened that are associated with the accuracy of mammography include age, breast density, whether it is the first or subsequent exam, and time since last mammogram. Younger women have lower sensitivity and higher false-positive rates on screening mammography than do older women (refer to the Breast Cancer Surveillance Consortium performance measures by age for more information). For women of all ages, high breast density is associated with 10% to 29% lower sensitivity.[1] High breast density is an inherent trait, which can be familial [2,3] but also may be affected by age, endogenous [4] and exogenous [5,6] hormones,[7] selective estrogen receptor modulators such as tamoxifen,[8] and diet.[9] Hormone therapy is associated with increased breast density and is associated not only with lower sensitivity but also with an increased rate of interval cancers.[10] The Million Women Study in the United Kingdom revealed three patient characteristics that were associated with decreased sensitivity and specificity of screening mammograms in women aged 50 to 64 years: use of postmenopausal hormone therapy, prior breast surgery, and body mass index below 25.[11] In addition, a longer interval since the last mammogram increases sensitivity, recall rate, and cancer detection rate and decreases specificity.[12] Strategies have been proposed to improve mammographic sensitivity by altering diet, timing mammograms with menstrual cycles, interrupting hormone therapy before the examination, or using digital mammography machines.[13] Obese women have more than a 20% increased risk of having false-positive mammography results compared with underweight and normal weight women, although sensitivity is unchanged.[14] Tumor Characteristics Some cancers are more easily detected by mammography than other cancers are. In particular, mucinous, lobular, and rapidly growing cancers can be missed because their appearance on x-rays is similar to that of normal breast tissue.[15] Medullary carcinomas may be similarly missed.[16] Some cancers, particularly those associated with BRCA1/2 mutations, masquerade as benign tumors.[17,18] Physician Characteristics Radiologist performance is critical to assessing mammographic interpretive performance, yet there is substantial, well-documented variability among radiologists. Factors that influence radiologists' performance include their level of experience and the volume of mammograms they interpret.[19] There is often a trade-off between sensitivity and specificity, such that higher sensitivity may be associated with lower specificity. Radiologists in academic settings have a higher positive predictive value (PPV) of their recommendations to undergo biopsy than do community radiologists.[20] Fellowship training in breast imaging may lead to improved cancer detection, but it is associated with higher false-positive rates.[13] Facility Characteristics After controlling for patient and radiologist characteristics, screening mammography interpretive performance (specificity, PPV, area under the curve [AUC]) varies by facility and is associated with facility-level characteristics. Higher interpretive accuracy of screening mammography was seen at facilities that offered screening examinations alone, included a breast imaging specialist on staff, did single as opposed to double readings, and reviewed interpretive audits two or more times each year.[21] False-positive rates vary significantly between facilities performing diagnostic mammography and are higher at facilities where concern about malpractice is high.[22] False-positive biopsy rates are also higher at facilities that perform diagnostic mammography and serve vulnerable women (racial or ethnic minority women and women with lower educational attainment, limited household income, or rural residence) than at facilities that perform diagnostic mammography and serve nonvulnerable women.[22] This may reflect radiologist concerns that vulnerable populations may be less likely to follow up after an abnormality is noted when the follow-up includes a short-interval follow-up or a clinic visit. Thus, radiologists may be more likely to recommend a biopsy as opposed to short-interval follow-up.[23] This may also represent radiologist concerns that this population may have a slightly higher cancer prevalence. International Comparisons International comparisons of screening mammography have found higher specificity in countries with more highly centralized screening systems and national quality assurance programs.[24,25] For example, one study reported that the recall rate is twice as high in the United States as it is in the United Kingdom, yet there is no difference in the rate of cancers detected. Such comparisons may be confounded by social, cultural, and economic factors.[25] Prevalent Versus Subsequent Examination and the Interval Between Exams The likelihood of diagnosing cancer is highest with the prevalent (first) screening examination, ranging from 9 to 26 cancers per 1,000 screens, depending on the woman's age. The likelihood decreases for follow-up examinations, ranging from 1 to 3 cancers per 1,000 screens.[26] The optimal interval between screening mammograms is unknown. In particular, the breast cancer mortality-focused, randomized, controlled trials used single screening intervals with little variability across the trials. A prospective United Kingdom trial randomly assigned women aged 50 to 62 years to receive mammograms annually or at the standard 3-year interval. Although the grade and node status were similar in both groups, more cancers of slightly smaller size were detected in the annual screening group, with a lead time of approximately 7 months in comparison with triennial screening.[27] A large observational study found a slightly increased risk of late-stage disease at diagnosis for women in their 40s who were adhering to a 2-year versus a 1-year schedule (28% vs. 21%; odds ratio [OR], 1.35; 95% confidence interval [CI], 1.01-1.81), but no difference was seen for women in their 50s or 60s.[28,29] A Finnish study of 14,765 women aged 40 to 49 years assigned women born in even-numbered years to annual screens and women born in odd-numbered years to triennial screens. The study was small in terms of number of deaths, with low power to discriminate breast cancer mortality between the two groups. There were 18 deaths from breast cancer in 100,738 life-years in the triennial screening group and 18 deaths from breast cancer in 88,780 life-years in the annual screening group (hazard ratio, 0.88; 95% CI, 0.59-1.27).[30] References:
-
Rosenberg RD, Hunt WC, Williamson MR, et al.: Effects of age, breast density, ethnicity, and estrogen replacement therapy on screening mammographic sensitivity and cancer stage at diagnosis: review of 183,134 screening mammograms in Albuquerque, New Mexico. Radiology 209 (2): 511-8, 1998.
-
Pankow JS, Vachon CM, Kuni CC, et al.: Genetic analysis of mammographic breast density in adult women: evidence of a gene effect. J Natl Cancer Inst 89 (8): 549-56, 1997.
-
Boyd NF, Dite GS, Stone J, et al.: Heritability of mammographic density, a risk factor for breast cancer. N Engl J Med 347 (12): 886-94, 2002.
-
White E, Velentgas P, Mandelson MT, et al.: Variation in mammographic breast density by time in menstrual cycle among women aged 40-49 years. J Natl Cancer Inst 90 (12): 906-10, 1998.
-
Harvey JA, Pinkerton JV, Herman CR: Short-term cessation of hormone replacement therapy and improvement of mammographic specificity. J Natl Cancer Inst 89 (21): 1623-5, 1997.
-
Laya MB, Larson EB, Taplin SH, et al.: Effect of estrogen replacement therapy on the specificity and sensitivity of screening mammography. J Natl Cancer Inst 88 (10): 643-9, 1996.
-
Baines CJ, Dayan R: A tangled web: factors likely to affect the efficacy of screening mammography. J Natl Cancer Inst 91 (10): 833-8, 1999.
-
Brisson J, Brisson B, Coté G, et al.: Tamoxifen and mammographic breast densities. Cancer Epidemiol Biomarkers Prev 9 (9): 911-5, 2000.
-
Boyd NF, Greenberg C, Lockwood G, et al.: Effects at two years of a low-fat, high-carbohydrate diet on radiologic features of the breast: results from a randomized trial. Canadian Diet and Breast Cancer Prevention Study Group. J Natl Cancer Inst 89 (7): 488-96, 1997.
-
Crouchley K, Wylie E, Khong E: Hormone replacement therapy and mammographic screening outcomes in Western Australia. J Med Screen 13 (2): 93-7, 2006.
-
Banks E, Reeves G, Beral V, et al.: Influence of personal characteristics of individual women on sensitivity and specificity of mammography in the Million Women Study: cohort study. BMJ 329 (7464): 477, 2004.
-
Yankaskas BC, Taplin SH, Ichikawa L, et al.: Association between mammography timing and measures of screening performance in the United States. Radiology 234 (2): 363-73, 2005.
-
Pisano ED, Gatsonis C, Hendrick E, et al.: Diagnostic performance of digital versus film mammography for breast-cancer screening. N Engl J Med 353 (17): 1773-83, 2005.
-
Elmore JG, Carney PA, Abraham LA, et al.: The association between obesity and screening mammography accuracy. Arch Intern Med 164 (10): 1140-7, 2004.
-
Porter PL, El-Bastawissi AY, Mandelson MT, et al.: Breast tumor characteristics as predictors of mammographic detection: comparison of interval- and screen-detected cancers. J Natl Cancer Inst 91 (23): 2020-8, 1999.
-
Wallis MG, Walsh MT, Lee JR: A review of false negative mammography in a symptomatic population. Clin Radiol 44 (1): 13-5, 1991.
-
Tilanus-Linthorst M, Verhoog L, Obdeijn IM, et al.: A BRCA1/2 mutation, high breast density and prominent pushing margins of a tumor independently contribute to a frequent false-negative mammography. Int J Cancer 102 (1): 91-5, 2002.
-
Ganott MA, Harris KM, Klaman HM, et al.: Analysis of False-Negative Cancer Cases Identified with a Mammography Audit. Breast J 5 (3): 166-175, 1999.
-
Elmore JG, Jackson SL, Abraham L, et al.: Variability in interpretive performance at screening mammography and radiologists' characteristics associated with accuracy. Radiology 253 (3): 641-51, 2009.
-
Meyer JE, Eberlein TJ, Stomper PC, et al.: Biopsy of occult breast lesions. Analysis of 1261 abnormalities. JAMA 263 (17): 2341-3, 1990.
-
Taplin S, Abraham L, Barlow WE, et al.: Mammography facility characteristics associated with interpretive accuracy of screening mammography. J Natl Cancer Inst 100 (12): 876-87, 2008.
-
Jackson SL, Taplin SH, Sickles EA, et al.: Variability of interpretive accuracy among diagnostic mammography facilities. J Natl Cancer Inst 101 (11): 814-27, 2009.
-
Goldman LE, Walker R, Miglioretti DL, et al.: Accuracy of diagnostic mammography at facilities serving vulnerable women. Med Care 49 (1): 67-75, 2011.
-
Smith-Bindman R, Chu PW, Miglioretti DL, et al.: Comparison of screening mammography in the United States and the United kingdom. JAMA 290 (16): 2129-37, 2003.
-
Elmore JG, Nakano CY, Koepsell TD, et al.: International variation in screening mammography interpretations in community-based programs. J Natl Cancer Inst 95 (18): 1384-93, 2003.
-
Kerlikowske K, Grady D, Barclay J, et al.: Positive predictive value of screening mammography by age and family history of breast cancer. JAMA 270 (20): 2444-50, 1993.
-
The Breast Screening Frequency Trial Group: The frequency of breast cancer screening: results from the UKCCCR Randomised Trial. United Kingdom Co-ordinating Committee on Cancer Research. Eur J Cancer 38 (11): 1458-64, 2002.
-
White E, Miglioretti DL, Yankaskas BC, et al.: Biennial versus annual mammography and the risk of late-stage breast cancer. J Natl Cancer Inst 96 (24): 1832-9, 2004.
-
Mandelblatt JS, Cronin KA, Bailey S, et al.: Effects of mammography screening under different screening schedules: model estimates of potential benefits and harms. Ann Intern Med 151 (10): 738-47, 2009.
-
Parvinen I, Chiu S, Pylkkänen L, et al.: Effects of annual vs triennial mammography interval on breast cancer incidence and mortality in ages 40-49 in Finland. Br J Cancer 105 (9): 1388-91, 2011.
Harms of ScreeningMammography screening may be effective in reducing breast cancer mortality in certain populations, but it can pose harm to women who participate. The limitations are best described as false positives (related to the specificity of the test), overdiagnosis (true positives that will not become clinically significant), false negatives (related to the sensitivity of the test), discomfort associated with the test, radiation risk and anxiety. Table 2 provides an overview of the estimated benefits and harms of screening mammography for 10,000 women who undergo annual screening mammography over a 10-year period.[1] Table 2. Estimated Benefits and Harms of Mammography Screening for 10,000 Women Who Undergo Annual Screening Mammography Over a 10-Year Perioda| Age, y | No. of Breast Cancer Deaths Averted With Mammography Screening Over Next 15 yb | No. (95% CI) With ≥1 False-Positive Result During the 10 yc | No. (95% CI) With ≥1 False Positive Resulting in a Biopsy During the 10 yc | No. of Breast Cancers or DCIS Diagnosed During the 10 y That Would Never Become Clinically Important (Overdiagnosis)d |
|---|
| No. = number; CI = confidence interval; DCIS = ductal carcinomain situ. | | a Adapted from Pace and Keating.[1] | | b Number of deaths averted are from Welch and Passow.[2]The lower bound represents breast cancer mortality reduction if the breast cancer mortality relative risk were 0.95 (based on minimal benefit from the Canadian trials[3,4]), and the upper bound represents the breast cancer mortality reduction if the relative risk were 0.64 (based on the Swedish 2-County Trial[5]). | | c False positive and biopsy estimates and 95% confidence intervals are 10-year cumulative risks reported in Hubbard et al.[6]and Braithwaite et al.[7] | | d Overdiagnosed cases are calculated by Welch and Passow.[2]The lower bound represents overdiagnosis based on results from the Malmö trial,[8]whereas the upper bound represents the estimate from Bleyer and Welch.[9] | | e The lower-bound estimate for overdiagnosis reported by Welch and Passow[2]came from the Malmö study.[8]The study did not enroll women younger than 50 years. | | 40 | 1-16 | 6,130 (5,940-6,310) | 700 (610-780) | ?-104e | | 50 | 3-32 | 6,130 (5,800-6,470) | 940 (740-1,150) | 30-137 | | 60 | 5-49 | 4,970 (4,780-5,150) | 980 (840-1,130) | 64-194 | False Positives Leading to Possible Additional Interventions The specificity of mammography (refer to the Breast Cancer Screening Concepts section of this summary for more information) affects the number of additional interventions resulting from false-positive results. Even though breast cancer is the most common noncutaneous cancer in women, fewer than 5 per 1,000 women actually have the disease when they are screened. Therefore, even with a specificity of 90%, most abnormal mammograms are false positives.[10] Women with abnormal screening mammograms undergo additional mammographic imaging to magnify the area of concern, ultrasound, magnetic resonance imaging, and tissue sampling (by fine-needle aspiration, core biopsy, or excisional biopsy). A study of breast cancer screening in 2,400 women enrolled in a health maintenance organization found that over a 10-year period, 88 cancers were diagnosed, 58 of which were identified by mammography. During that period, one-third of the women had an abnormal mammogram result that required additional testing, including 539 additional mammograms, 186 ultrasound examinations, and 188 biopsies. The cumulative biopsy rate (the rate of true positives) resulting from mammographic findings was approximately 1 in 4 (23.6%). The positive predictive value (PPV) of an abnormal screening mammogram in this population was 6.3% for women aged 40 to 49 years, 6.6% for women aged 50 to 59 years, and 7.8% for women aged 60 to 69 years.[11] A subsequent analysis and modeling of data from the same cohort of women, all of whom were continuously enrolled in the Harvard Pilgrim Health Care plan from July 1983 through June 1995, estimated that the risk of having at least one false-positive mammogram was 7.4% (95% confidence interval [CI], 6.4%-8.5%) at the first mammogram, 26.0% (95% CI, 24.0%-28.2%) by the fifth mammogram, and 43.1% (95% CI, 36.6%-53.6%) by the ninth mammogram.[12] Cumulative risk of at least one false-positive result by the ninth mammogram varied from 5% to 100%, depending on four patient variables (younger age, higher number of previous breast biopsies, family history of breast cancer, and current estrogen use) and three radiologic variables (longer time between screenings, failure to compare the current and previous mammograms, and the individual radiologist's tendency to interpret mammograms as abnormal). Overall, the biggest risk factor for having a false-positive mammogram was the individual radiologist's tendency to read mammograms as abnormal. A prospective cohort study of community-based screening found that a greater proportion of women undergoing annual screening had at least one false-positive screen after 10 years than did women undergoing biennial screening, regardless of breast density. For women with scattered fibroglandular densities, the difference was 68.9% (annual) versus 46.3% (biennial) for women in their 40s. For women aged 50 to 74 years, the difference for this density group was 49.8% (annual) versus 30.7% (biennial).[13] By reviewing Medicare claims following mammographic screening in 23,172 women older than 65 years, one study [14] found that, per 1,000 women, 85 had follow-up testing, 23 had biopsies, and 7 had cancer. Thus, the PPV for an abnormal mammogram was 8%. For women older than 70 years, the PPV was 14%. An audit of mammograms performed in 1998 at a single institution revealed that 14.7% of examinations resulted in a recommendation for additional testing (Breast Imaging Reporting and Data System category 0), 1.8% resulted in a recommendation for biopsy (categories 4 and 5), and 5.7% resulted in a recommendation for short-term interval mammography (category 3). Cancer was diagnosed in 0.5% of the cases referred for additional testing.[15] As shown in Table 2, the estimated number of women out of 10,000 who undergo annual screening mammography over a 10-year period with at least one false-positive result is 6,130 for women aged 40 to 50 years and 4,970 for women aged 60 years. The number of women with a false positive resulting in a biopsy is estimated to range from 700 to 980, depending on age.[1] Overdiagnosis Overdiagnosed disease is defined as a neoplasm that would never become clinically apparent in the absence of screening. The prevalence of cancer in women who died of noncancer causes is surprisingly high. In an overview of seven autopsy studies, the median prevalence of occult invasive breast cancer was 1.3% (range, 0%-1.8%) and of ductal carcinoma in situ was 8.9% (range, 0%-14.7%).[16,17] Currently, physicians cannot confidently distinguish cancers that will cause illness and/or death from those that will remain occult, so cancers are treated in almost all cases. To determine the number of screen-detected cancers that are overdiagnosed, one can compare breast cancer incidence over time in a screened population with that of an unscreened population. Population-based studies could demonstrate the extent of overdiagnosis if the screened and nonscreened populations were the same except for screening. Unfortunately, the populations may differ in time, geography, health behaviors, and the use of postmenopausal hormone therapy. Investigators also differ in their calculation of overdiagnosis as they adjust for characteristics such as lead-time bias.[18,19] As a consequence, the magnitude of overdiagnosis resulting from mammographic screening is controversial, with estimates ranging from 0% to 54%.[8,18,19,20] Several observational population-based comparisons consider breast cancer incidence before and after adoption of screening.[21,22,23,24,25] If there were no overdiagnosis-and other aspects of screening were unchanged-there would be a rise in incidence followed by a decrease to below the prescreening level, and the cumulative incidence would be similar. Such results have not been observed. An increase in breast cancer incidence rates have been noted at the initiation of screening without a compensatory drop in later years. For example, one study in 11 rural Swedish counties showed a persistent increase in breast cancer incidence following the advent of screening.[22] Another population-based study showed increases in invasive breast cancer incidence of 54% in Norway and 45% in Sweden in women aged 50 to 69 years, following the introduction of nationwide screening programs.[26] Similar findings suggestive of overdiagnosis have been reported from the United Kingdom [23] and the United States.[24,25] An indication of possible overdiagnosis is that increases in breast cancer incidence because of screening tend to occur in early stages of the disease with little or no drop in later stages. A cohort study in Norway compared the increase in cancer incidence in women eligible for screening based on age after the introduction of screening within the respective counties, with the cancer incidence in younger women not eligible for screening. Eligible women experienced a 60% increase in incidence of localized cancers (relative risk [RR], 1.60; 95% CI, 1.42-1.79), while the incidence of advanced cancers remained similar in the two groups (RR, 1.08; 95% CI, 0.86-1.35).[27] A population study that compared different counties in the United States showed that higher rates of screening mammography use were associated with higher rates of breast cancer diagnoses, yet no corresponding decrease in 10-year breast cancer mortality was seen.[28] The strengths of this study include its very large size (16 million women) and the strength and consistency of correlation observed across counties. The limitations of this study include the inherent limitations of ecological studies (ecological studies relate the frequency with which an exposure or intervention, i.e., screening mammography, and an outcome, i.e., cancer diagnosis or mortality, occur in the same geographic area or care setting) and the three following design features, which could cause measurements to be unreliable:[28] - The self-reporting of mammographic screening, which can result in misidentifying diagnostic mammograms as screening mammograms.
- The use of a 2-year window rather than 1-year window to estimate prevalence of screening mammography, which may overestimate prevalence of screening.
- Period of analysis (a transient bump in breast cancer incidence resulting from hormone replacement therapy).
An analytic approach was used to approximate the magnitude of overdiagnosis and the contributions of screening versus treatment to breast cancer mortality reduction.[29] The shift in the size distribution of breast cancers in the United States from 1975 to 2012, an interval that spans the period from before the introduction of mammography to after its widespread dissemination, was investigated using Surveillance, Epidemiology, and End Results (SEER) data in women aged 40 years and older under the assumption that the rate of clinically meaningful breast cancer was stable over this period. When women diagnosed from 1975 to 1979 were compared with women diagnosed from 2008 to 2012, the incidence of large tumors (≥ 2 cm) decreased by 30 cases per 100,000 women, whereas the incidence of invasive tumors smaller than 2 cm and ductal carcinoma in situ (DCIS) increased by 162 cases per 100,000 women, suggesting overdiagnosis of 132 cases per 100,000 women. Estimates of the extent of overdiagnosis noted in the Canadian National Breast Screening Study, a randomized clinical trial, have been reported. At the end of the five screening rounds, an excess of 142 invasive breast cancer cases was diagnosed in the mammography arm, compared with the control arm.[30] At 15 years, the excess number of cancer cases in the mammography arm versus the control arm was 106; this represents an overdiagnosis rate of 22% for the 484 screen-detected invasive cancers.[30] Table 2 shows the estimated number of women with breast cancers or DCIS diagnosed during a 10-year period of screening 10,000 women that would never become clinically important (overdiagnosis). There was no overdiagnosis in the Health Insurance Plan study, which used old-technology mammography and clinical breast examination. Overdiagnosis has become more prominent in the era of improved-technology mammography. However, the benefits of newer-technology mammography over older-technology mammography in regard to reduced mortality have not been demonstrated.[1] False Negatives Leading to Possible False Sense of Security The sensitivity of mammography (refer to the Breast Cancer Screening Concepts section of this summary for more information) ranges from 70% to 90%, depending on a woman's age and the density of her breasts, which is affected by her genetic predisposition, hormone status, and diet. Assuming an average sensitivity of 80%, mammograms will miss approximately 20% of the breast cancers that are present at the time of screening (false negatives). Many of these missed cancers are high risk, with adverse biologic characteristics (refer to the Interval cancers section in the Breast Cancer Screening Concepts section of this summary for more information). If a normal mammogram dissuades or postpones a woman or her doctor from evaluating breast symptoms, she may suffer adverse consequences. Thus, a negative mammogram should never prevent a work-up of breast symptoms. Discomfort Compression of the breast is important during a mammogram to reduce motion artifact and improve image quality. Positioning of the woman is important. One study that evaluated how often pain and discomfort are felt during mammography reported that 90% of women undergoing mammography had discomfort, and 12% of women rated the sensation as intense or intolerable.[31] A systematic review of 22 studies investigating pain and discomfort associated with mammography found that the prevalence of pain varied widely. The degree of pain was associated with the stage of menstrual cycle, anxiety, and premammography anticipation of pain.[32] Radiation Exposure The major predictors of radiation risk are young age at exposure and dose. For women older than 40 years, the benefits of annual mammograms probably outweigh the potential risk,[33] but certain subpopulations of women may have an inherited susceptibility to ionizing radiation damage.[34,35] In the United States, the mean glandular dose for screening mammography is 1 mSv to 2 mSv per view or 2 mSv to 4 mSv per standard two-view exam.[36,37] The radiation exposure from mammography is to the breasts, with a lower effective dose to the whole body of 0.29 mSv. Thus, it may be estimated that up to one breast cancer may be induced per 1,000 women aged 40 to 80 years undergoing annual mammograms. Based on statistical models, the risk would be doubled in women with large breasts who require increased radiation doses and in women with breast augmentation who require additional views. Radiation-induced breast cancers may be reduced fivefold for women who begin biennial screening at age 50 years rather than annually at age 40 years.[38] Anxiety Because large numbers of women have false-positive tests, the issue of psychological distress-which may be provoked by the additional testing-has been studied. A telephone survey of 308 women performed 3 months after screening mammography revealed that about one-fourth of the 68 women with a suspicious result were still experiencing worry that affected their mood or functioning, even though subsequent testing had ruled out a cancer diagnosis.[39] Research into whether or not the psychological impact of a false-positive test is long standing has found mixed results. A cohort study in Spain in 2002 found immediate psychological impact of receiving a false-positive mammogram, but these results dissipated within a few months.[40] A cohort study in Denmark in 2013 measuring the psychological effects of a false positive several years past the event found long-term negative psychological consequences associated with the experience of receiving a false-positive mammogram.[41] Several studies showed that the anxiety following evaluation of a false-positive test led to increased participation in future screening examinations.[42,43,44,45] References:
-
Pace LE, Keating NL: A systematic assessment of benefits and risks to guide breast cancer screening decisions. JAMA 311 (13): 1327-35, 2014.
-
Welch HG, Passow HJ: Quantifying the benefits and harms of screening mammography. JAMA Intern Med 174 (3): 448-54, 2014.
-
Miller AB, To T, Baines CJ, et al.: The Canadian National Breast Screening Study-1: breast cancer mortality after 11 to 16 years of follow-up. A randomized screening trial of mammography in women age 40 to 49 years. Ann Intern Med 137 (5 Part 1): 305-12, 2002.
-
Miller AB, To T, Baines CJ, et al.: Canadian National Breast Screening Study-2: 13-year results of a randomized trial in women aged 50-59 years. J Natl Cancer Inst 92 (18): 1490-9, 2000.
-
Tabár L, Vitak B, Chen TH, et al.: Swedish two-county trial: impact of mammographic screening on breast cancer mortality during 3 decades. Radiology 260 (3): 658-63, 2011.
-
Hubbard RA, Kerlikowske K, Flowers CI, et al.: Cumulative probability of false-positive recall or biopsy recommendation after 10 years of screening mammography: a cohort study. Ann Intern Med 155 (8): 481-92, 2011.
-
Braithwaite D, Zhu W, Hubbard RA, et al.: Screening outcomes in older US women undergoing multiple mammograms in community practice: does interval, age, or comorbidity score affect tumor characteristics or false positive rates? J Natl Cancer Inst 105 (5): 334-41, 2013.
-
Zackrisson S, Andersson I, Janzon L, et al.: Rate of over-diagnosis of breast cancer 15 years after end of Malmö mammographic screening trial: follow-up study. BMJ 332 (7543): 689-92, 2006.
-
Bleyer A, Welch HG: Effect of three decades of screening mammography on breast-cancer incidence. N Engl J Med 367 (21): 1998-2005, 2012.
-
Kerlikowske K, Grady D, Barclay J, et al.: Positive predictive value of screening mammography by age and family history of breast cancer. JAMA 270 (20): 2444-50, 1993.
-
Elmore JG, Barton MB, Moceri VM, et al.: Ten-year risk of false positive screening mammograms and clinical breast examinations. N Engl J Med 338 (16): 1089-96, 1998.
-
Christiansen CL, Wang F, Barton MB, et al.: Predicting the cumulative risk of false-positive mammograms. J Natl Cancer Inst 92 (20): 1657-66, 2000.
-
Kerlikowske K, Zhu W, Hubbard RA, et al.: Outcomes of screening mammography by frequency, breast density, and postmenopausal hormone therapy. JAMA Intern Med 173 (9): 807-16, 2013.
-
Welch HG, Fisher ES: Diagnostic testing following screening mammography in the elderly. J Natl Cancer Inst 90 (18): 1389-92, 1998.
-
Rosen EL, Baker JA, Soo MS: Malignant lesions initially subjected to short-term mammographic follow-up. Radiology 223 (1): 221-8, 2002.
-
Welch HG, Black WC: Using autopsy series to estimate the disease "reservoir" for ductal carcinoma in situ of the breast: how much more breast cancer can we find? Ann Intern Med 127 (11): 1023-8, 1997.
-
Black WC, Welch HG: Advances in diagnostic imaging and overestimations of disease prevalence and the benefits of therapy. N Engl J Med 328 (17): 1237-43, 1993.
-
Duffy SW, Lynge E, Jonsson H, et al.: Complexities in the estimation of overdiagnosis in breast cancer screening. Br J Cancer 99 (7): 1176-8, 2008.
-
Gøtzsche PC, Jørgensen KJ, Maehlen J, et al.: Estimation of lead time and overdiagnosis in breast cancer screening. Br J Cancer 100 (1): 219; author reply 220, 2009.
-
Gøtzsche PC, Nielsen M: Screening for breast cancer with mammography. Cochrane Database Syst Rev (4): CD001877, 2006.
-
Hemminki K, Rawal R, Bermejo JL: Mammographic screening is dramatically changing age-incidence data for breast cancer. J Clin Oncol 22 (22): 4652-3, 2004.
-
Jonsson H, Johansson R, Lenner P: Increased incidence of invasive breast cancer after the introduction of service screening with mammography in Sweden. Int J Cancer 117 (5): 842-7, 2005.
-
Johnson A, Shekhdar J: Breast cancer incidence: what do the figures mean? J Eval Clin Pract 11 (1): 27-31, 2005.
-
White E, Lee CY, Kristal AR: Evaluation of the increase in breast cancer incidence in relation to mammography use. J Natl Cancer Inst 82 (19): 1546-52, 1990.
-
Feuer EJ, Wun LM: How much of the recent rise in breast cancer incidence can be explained by increases in mammography utilization? A dynamic population model approach. Am J Epidemiol 136 (12): 1423-36, 1992.
-
Zahl PH, Strand BH, Maehlen J: Incidence of breast cancer in Norway and Sweden during introduction of nationwide screening: prospective cohort study. BMJ 328 (7445): 921-4, 2004.
-
Lousdal ML, Kristiansen IS, Møller B, et al.: Effect of organised mammography screening on stage-specific incidence in Norway: population study. Br J Cancer 114 (5): 590-6, 2016.
-
Harding C, Pompei F, Burmistrov D, et al.: Breast Cancer Screening, Incidence, and Mortality Across US Counties. JAMA Intern Med 175 (9): 1483-9, 2015.
-
Welch HG, Prorok PC, O'Malley AJ, et al.: Breast-Cancer Tumor Size, Overdiagnosis, and Mammography Screening Effectiveness. N Engl J Med 375 (15): 1438-1447, 2016.
-
Miller AB, Wall C, Baines CJ, et al.: Twenty five year follow-up for breast cancer incidence and mortality of the Canadian National Breast Screening Study: randomised screening trial. BMJ 348: g366, 2014.
-
Freitas R 2nd, Fiori WF, Ramos FJ, et al.: [Discomfort and pain during mammography]. Rev Assoc Med Bras 52 (5): 333-6, 2006 Sep-Oct.
-
Armstrong K, Moye E, Williams S, et al.: Screening mammography in women 40 to 49 years of age: a systematic review for the American College of Physicians. Ann Intern Med 146 (7): 516-26, 2007.
-
Feig SA, Ehrlich SM: Estimation of radiation risk from screening mammography: recent trends and comparison with expected benefits. Radiology 174 (3 Pt 1): 638-47, 1990.
-
Helzlsouer KJ, Harris EL, Parshad R, et al.: Familial clustering of breast cancer: possible interaction between DNA repair proficiency and radiation exposure in the development of breast cancer. Int J Cancer 64 (1): 14-7, 1995.
-
Swift M, Morrell D, Massey RB, et al.: Incidence of cancer in 161 families affected by ataxia-telangiectasia. N Engl J Med 325 (26): 1831-6, 1991.
-
Kopans DB: Mammography and radiation risk. In: Janower ML, Linton OW, eds.: Radiation Risk: a Primer. Reston, Va: American College of Radiology, 1996, pp 21-22.
-
Suleiman OH, Spelic DC, McCrohan JL, et al.: Mammography in the 1990s: the United States and Canada. Radiology 210 (2): 345-51, 1999.
-
Miglioretti DL, Lange J, van den Broek JJ, et al.: Radiation-Induced Breast Cancer Incidence and Mortality From Digital Mammography Screening: A Modeling Study. Ann Intern Med 164 (4): 205-14, 2016.
-
Lerman C, Trock B, Rimer BK, et al.: Psychological side effects of breast cancer screening. Health Psychol 10 (4): 259-67, 1991.
-
Sandin B, Chorot P, Valiente RM, et al.: Adverse psychological effects in women attending a second-stage breast cancer screening. J Psychosom Res 52 (5): 303-9, 2002.
-
Brodersen J, Siersma VD: Long-term psychosocial consequences of false-positive screening mammography. Ann Fam Med 11 (2): 106-15, 2013 Mar-Apr.
-
Gram IT, Lund E, Slenker SE: Quality of life following a false positive mammogram. Br J Cancer 62 (6): 1018-22, 1990.
-
Burman ML, Taplin SH, Herta DF, et al.: Effect of false-positive mammograms on interval breast cancer screening in a health maintenance organization. Ann Intern Med 131 (1): 1-6, 1999.
-
Pisano ED, Earp J, Schell M, et al.: Screening behavior of women after a false-positive mammogram. Radiology 208 (1): 245-9, 1998.
-
Brewer NT, Salz T, Lillie SE: Systematic review: the long-term effects of false-positive mammograms. Ann Intern Med 146 (7): 502-10, 2007.
Breast Cancer Screening Modalities-Beyond Breast ImagingClinical Breast Examination No randomized trials of clinical breast examination (CBE) as a sole screening modality have yet been reported. The Canadian National Breast Screening Study (NBSS) compared high-quality CBE plus mammography with CBE alone in women aged 50 to 59 years (refer to the Clinical Breast Examination section in the Overview section of this summary for more information). CBE, lasting 5 to 10 minutes per breast, was conducted by trained health professionals, with periodic evaluations of performance quality. The frequency of cancer diagnosis, stage, interval cancers, and breast cancer mortality were similar in the two groups and compared favorably with other trials of mammography alone, perhaps because of the careful training and supervision of the health professionals performing CBE.[1] Breast cancer mortality with follow-up 11 to 16 years after entry (mean = 13 years) was similar in the two screening arms (mortality rate ratio, 1.02 [95% confidence interval [CI], 0.78-1.33]).[2] The investigators estimated the operating characteristics for CBE alone; for 19,965 women aged 50 to 59 years, sensitivity was 83%, 71%, 57%, 83%, and 77% for years 1, 2, 3, 4, and 5 of the trial, respectively; specificity ranged between 88% and 96%. Positive predictive value (PPV), which is the proportion of cancers detected per abnormal examination, was estimated to be 3% to 4%. For 25,620 women aged 40 to 49 years who were examined only at entry, the estimated sensitivity was 71%, specificity was 84%, and PPV was 1.5%.[3] Among community clinicians, screening CBE has higher specificity (97%-99%) [4] and lower sensitivity (22%-36%) compared with examiners in clinical trials of breast cancer screening.[5,6,7,8] A study of screening in women with a positive family history of breast cancer showed that, after a normal initial evaluation, the patient herself or her clinician performing a CBE identified more cancers than did mammography.[9] Another study examined the usefulness of adding CBE to screening mammography; among 61,688 women older than 40 years and screened by mammography and CBE, sensitivity for mammography was 78%, and combined mammography-CBE sensitivity was 82%. Specificity was lower for women undergoing both screening modalities than it was for women undergoing mammography alone (97% vs. 99%).[10] Two international trials of CBE are under way in India and Egypt. Breast Self-Examination Monthly breast self-examination (BSE) has been promoted, but there is no solid evidence that it is effective in reducing breast cancer mortality.[11,12] The only large, well-conducted, randomized clinical trial of BSE randomly assigned 266,064 women factory workers in Shanghai to receive either BSE instruction with reinforcement and encouragement, or instruction on the prevention of lower back pain. Neither group received any other breast cancer screening. After 10 to 11 years of follow-up, 135 breast cancer deaths occurred in the instruction group, and 131 cancer deaths occurred in the control group (relative risk [RR], 1.04; 95% CI, 0.82-1.33). Although the number of invasive breast cancers diagnosed in the two groups was about the same, women in the instruction group had more breast biopsies and more benign lesions diagnosed than did women in the control group.[13] Other research on BSE is limited. First, Leningrad investigators randomly assigned by cluster more than 100,000 women to BSE training or control. The group that received BSE training had more breast biopsies but no improvements in breast cancer mortality.[14] Second, in the United Kingdom Trial of Early Detection of Breast Cancer, two districts invited more than 63,500 women aged 45 to 64 years to educational sessions about BSE. After 10 years of follow-up, there was no difference in breast cancer mortality rates compared with those in women from centers without organized BSE education (RR, 1.07; 95% CI, 0.93-1.22).[15] Third, and last, a case-control study nested within the Canadian NBSS compared self-reported BSE frequency before enrollment with breast cancer mortality. Women who examined their breasts visually, used their finger pads for palpation, and used their three middle fingers had a lower breast cancer mortality rate.[16] Tissue Sampling (Fine-Needle Aspiration, Nipple Aspirate, Ductal Lavage) Various methods to analyze breast tissue for malignancy have been proposed as screening methods for breast cancer. Random periareolar fine-needle aspirates were performed in 480 women at high risk for breast cancer, and the women were monitored for a median of 45 months.[17] Twenty women developed breast neoplasms (13 invasive and 7 ductal carcinoma in situ[DCIS]). Using multiple logistic regression and Cox proportional hazards analysis, a diagnosis of hyperplasia with atypia was found to be associated with the subsequent development of DCIS and invasive breast cancer. Nipple aspirate fluid cytology was studied in 2,701 women who were monitored for subsequent incidence of breast cancer, with an average of 12.7 years of follow-up.[18] Breast cancer incidence overall was 4.4%, including 11 cases of DCIS and 93 cases of invasive cancer, and was associated with abnormal nipple aspirate fluid cytology. Whereas the breast neoplasm rate was only 2.6% for 352 women in whom no fluid could be aspirated, it was 5.5% for 327 women with epithelial hyperplasia and 10.3% for 58 women with atypical hyperplasia. One study reported results of nipple aspiration followed by ductal lavage in 507 women at high risk for breast cancer.[19] Nipple aspirate fluid was obtained from 417 women, but only 111 (27%) were adequate samples. A total of 383 ductal lavage samples were evaluated, 299 (78%) of which were adequate for diagnosis. Abnormal cells were found in 92 (24%) ductal lavage samples, including 88 (17%) with mild atypia, 23 (6%) with marked atypia, and 1 (<1%) malignant. The corresponding numbers and percentages for nipple aspiration fluid were 16 (6%), 8 (3%), and 1 (<1%). Discomfort with the ductal lavage procedure was judged by participants to be comparable with mammography. Because ductal lavage screening has not been compared with mammography, and there is no evidence of efficacy or mortality reduction, its use as a screening or diagnostic tool remains investigational. References:
-
Baines CJ: The Canadian National Breast Screening Study: a perspective on criticisms. Ann Intern Med 120 (4): 326-34, 1994.
-
Miller AB, To T, Baines CJ, et al.: Canadian National Breast Screening Study-2: 13-year results of a randomized trial in women aged 50-59 years. J Natl Cancer Inst 92 (18): 1490-9, 2000.
-
Baines CJ, Miller AB, Bassett AA: Physical examination. Its role as a single screening modality in the Canadian National Breast Screening Study. Cancer 63 (9): 1816-22, 1989.
-
Fenton JJ, Rolnick SJ, Harris EL, et al.: Specificity of clinical breast examination in community practice. J Gen Intern Med 22 (3): 332-7, 2007.
-
Fenton JJ, Barton MB, Geiger AM, et al.: Screening clinical breast examination: how often does it miss lethal breast cancer? J Natl Cancer Inst Monogr (35): 67-71, 2005.
-
Bobo JK, Lee NC, Thames SF: Findings from 752,081 clinical breast examinations reported to a national screening program from 1995 through 1998. J Natl Cancer Inst 92 (12): 971-6, 2000.
-
Oestreicher N, White E, Lehman CD, et al.: Predictors of sensitivity of clinical breast examination (CBE). Breast Cancer Res Treat 76 (1): 73-81, 2002.
-
Kolb TM, Lichy J, Newhouse JH: Comparison of the performance of screening mammography, physical examination, and breast US and evaluation of factors that influence them: an analysis of 27,825 patient evaluations. Radiology 225 (1): 165-75, 2002.
-
Gui GP, Hogben RK, Walsh G, et al.: The incidence of breast cancer from screening women according to predicted family history risk: Does annual clinical examination add to mammography? Eur J Cancer 37 (13): 1668-73, 2001.
-
Oestreicher N, Lehman CD, Seger DJ, et al.: The incremental contribution of clinical breast examination to invasive cancer detection in a mammography screening program. AJR Am J Roentgenol 184 (2): 428-32, 2005.
-
Baxter N; Canadian Task Force on Preventive Health Care: Preventive health care, 2001 update: should women be routinely taught breast self-examination to screen for breast cancer? CMAJ 164 (13): 1837-46, 2001.
-
Humphrey LL, Helfand M, Chan BK, et al.: Breast cancer screening: a summary of the evidence for the U.S. Preventive Services Task Force. Ann Intern Med 137 (5 Part 1): 347-60, 2002.
-
Thomas DB, Gao DL, Ray RM, et al.: Randomized trial of breast self-examination in Shanghai: final results. J Natl Cancer Inst 94 (19): 1445-57, 2002.
-
Semiglazov VF, Moiseyenko VM, Bavli JL, et al.: The role of breast self-examination in early breast cancer detection (results of the 5-years USSR/WHO randomized study in Leningrad). Eur J Epidemiol 8 (4): 498-502, 1992.
-
Ellman R, Moss SM, Coleman D, et al.: Breast cancer mortality after 10 years in the UK trial of early detection of breast cancer. UK Trial of Early Detection of Breast Cancer Group. The Breast 2 (1): 13-20, 1993.
-
Harvey BJ, Miller AB, Baines CJ, et al.: Effect of breast self-examination techniques on the risk of death from breast cancer. CMAJ 157 (9): 1205-12, 1997.
-
Fabian CJ, Kimler BF, Zalles CM, et al.: Short-term breast cancer prediction by random periareolar fine-needle aspiration cytology and the Gail risk model. J Natl Cancer Inst 92 (15): 1217-27, 2000.
-
Wrensch MR, Petrakis NL, King EB, et al.: Breast cancer incidence in women with abnormal cytology in nipple aspirates of breast fluid. Am J Epidemiol 135 (2): 130-41, 1992.
-
Dooley WC, Ljung BM, Veronesi U, et al.: Ductal lavage for detection of cellular atypia in women at high risk for breast cancer. J Natl Cancer Inst 93 (21): 1624-32, 2001.
Special PopulationsIndividuals With Little to Gain from Screening Women with limited life expectancy Achieving balance between the benefits and harms of screening is especially important for women with a life expectancy of 5 years or less. Such women might have end-stage renal disease, severe dementia, terminal cancer, or severe comorbid disease with functional dependencies in activities of daily living. Early cancer detection and prompt treatment are unlikely to reduce morbidity or mortality within a woman's 5 years of expected survival, but the negative consequences of screening will occur immediately. Abnormal screening may trigger additional testing, with the attendant anxiety. In particular, the detection of a low-risk malignancy would probably result in a recommendation for treatment, which could impair rather than improve quality of life, without improving survival. Despite these considerations, many women with poor life expectancy as a result of age or health status often undergo screening mammography.[1] A sizable proportion of patients with advanced cancer continue to undergo cancer screening tests that do not have a meaningful likelihood of providing benefit. For example, among women with advanced cancer compared with controls, at least one screening mammogram was received by 8.9% (95% confidence interval [CI], 8.6%-9.1%) versus 22.0% (95% CI, 21.7%-22.5%).[2] Older women Screening mammography in women older than 65 years often results in additional diagnostic testing in 85 per 1,000 women, with cancer diagnosed in nine women. The testing is often accomplished over many months, which may cause anxiety.[3] While screening mammography may yield cancer diagnoses in approximately 1% of elderly women, many of these cancers are low risk. A study of California Medicare beneficiaries aged 65 to 79 years demonstrated this clearly. The relative risk (RR) of detecting localized breast cancer was 3.3 (95% CI, 3.1-3.5) among screened women. Diagnosis of metastatic cancer was reduced among screened women (RR, 0.57), suggesting a benefit of mammography screening in elderly women, although it comes with an increased risk of overdiagnosis.[4] Young women There is no evidence for performing screening mammography in average-risk women younger than 40 years. Men Approximately 1% of all breast cancers occur in men. Most cases are diagnosed during the evaluation of palpable lesions, which are generally easy to detect. Treatment consists of surgery, radiation, and systemic adjuvant hormone therapy or chemotherapy. Because of the rarity of the disease, the usefulness of any screening modality is extremely unlikely. Individuals at Increased Risk of Breast Cancer and Thus Possibly With More to Gain From Screening Women who have received thoracic radiation Screening for breast cancer has been recommended for women exposed to therapeutic radiation to the chest, especially if they were exposed at an early age. One systematic review of observational studies of women exposed to large doses (≥20 Gy) of chest radiation before age 30 years found standardized incidence ratios of 13.3 to 55.5 for breast cancer, with no plateau with increasing age.[5] Screening mammography and magnetic resonance imaging can identify early-stage cancers in these women, but the benefits and risks have not been clearly defined. Race Although age-adjusted breast cancer incidence rates are higher in white women than in black women, mortality rates are higher in black women. Among breast cancer cases diagnosed from 2004 to 2010, 62% of white women and only 52% of black women had localized disease. The 5-year relative survival rate for localized disease was 99.1% for white women and 94.0% for black women; for regional disease, it was 86.0% for white women and 74.6% for black women; and for distant disease, it was 26.2% for white women and 16.4% for black women.[6] Both breast cancer incidence and mortality are lower among Hispanic and Asian/Pacific Islander women than among white and black women.[6] Survival in black women may be worse than in white women at least in part because of a higher frequency of adverse histologic features, such as a triple-negative phenotype.[7] Several explanations for these findings have been proposed, including lower socioeconomic status, lower level of education, and less access to screening and treatment services. Population-based studies demonstrate that, compared with other groups, Medicaid recipients and uninsured patients of all races have later-stage breast cancer diagnosis, and survival from the time of diagnosis is shorter. These differences are associated with socioeconomic status and may reflect lack of participation in screening activities.[8,9] Black women older than 65 years are less likely to undergo mammogram screening. Among regular users of mammography, however, cancer was diagnosed in black and white women at similar stages.[10] Similar studies of Hispanic populations have been conducted. Breast cancer stage at diagnosis in San Diego County, California, was more advanced for Hispanic women than for white women, especially for those younger than 50 years. Low-income whites were more likely to have late-stage diagnosis than high-income whites. Among Hispanic women, there was no difference according to income, but all the Hispanic groups were at or below the lowest white income level.[11] In New Mexico, a population-based case-control study examined the reproductive histories of 719 Hispanic and 836 white breast cancer patients, with one-half of each group having breast cancer. The Hispanic women had higher body mass index, higher parity, and earlier pregnancies.[12] Whereas reproductive factors such as age at first full-term birth, parity, and duration of lactation accounted for some of the ethnic differences in breast cancer incidence for postmenopausal women, there was no evidence that these factors played a role in the differences for premenopausal patients. A study of mammography screening in an Albuquerque health maintenance organization found that Hispanic women had consistently lower rates of screening than did whites (50.6% vs. 65.5% in 1989, and 62.7% vs. 71.6% in 1996).[13] Predictors of more advanced stage at diagnosis included Hispanic race (odds ratio, 2.12) and younger age. References:
-
Walter LC, Lindquist K, Covinsky KE: Relationship between health status and use of screening mammography and Papanicolaou smears among women older than 70 years of age. Ann Intern Med 140 (9): 681-8, 2004.
-
Sima CS, Panageas KS, Schrag D: Cancer screening among patients with advanced cancer. JAMA 304 (14): 1584-91, 2010.
-
Welch HG, Fisher ES: Diagnostic testing following screening mammography in the elderly. J Natl Cancer Inst 90 (18): 1389-92, 1998.
-
Smith-Bindman R, Kerlikowske K, Gebretsadik T, et al.: Is screening mammography effective in elderly women? Am J Med 108 (2): 112-9, 2000.
-
Henderson TO, Amsterdam A, Bhatia S, et al.: Systematic review: surveillance for breast cancer in women treated with chest radiation for childhood, adolescent, or young adult cancer. Ann Intern Med 152 (7): 444-55; W144-54, 2010.
-
Howlader N, Noone AM, Krapcho M, et al., eds.: SEER Cancer Statistics Review, 1975-2011. Bethesda, Md: National Cancer Institute, 2014. Also available online. Last accessed March 29, 2017.
-
Bauer KR, Brown M, Cress RD, et al.: Descriptive analysis of estrogen receptor (ER)-negative, progesterone receptor (PR)-negative, and HER2-negative invasive breast cancer, the so-called triple-negative phenotype: a population-based study from the California cancer Registry. Cancer 109 (9): 1721-8, 2007.
-
Roetzheim RG, Pal N, Tennant C, et al.: Effects of health insurance and race on early detection of cancer. J Natl Cancer Inst 91 (16): 1409-15, 1999.
-
Bradley CJ, Given CW, Roberts C: Race, socioeconomic status, and breast cancer treatment and survival. J Natl Cancer Inst 94 (7): 490-6, 2002.
-
McCarthy EP, Burns RB, Coughlin SS, et al.: Mammography use helps to explain differences in breast cancer stage at diagnosis between older black and white women. Ann Intern Med 128 (9): 729-36, 1998.
-
Bentley JR, Delfino RJ, Taylor TH, et al.: Differences in breast cancer stage at diagnosis between non-Hispanic white and Hispanic populations, San Diego County 1988-1993. Breast Cancer Res Treat 50 (1): 1-9, 1998.
-
Gilliland FD, Hunt WC, Baumgartner KB, et al.: Reproductive risk factors for breast cancer in Hispanic and non-Hispanic white women: the New Mexico Women's Health Study. Am J Epidemiol 148 (7): 683-92, 1998.
-
Frost FJ, Tollestrup K, Trinkaus KM, et al.: Mammography screening and breast cancer tumor size in female members of a managed care organization. Cancer Epidemiol Biomarkers Prev 7 (7): 585-9, 1998.
Informed Medical Decision MakingInformed medical decision making is increasingly recommended for individuals who are considering cancer screening. Many different types and formats of decision aids have been studied. (Refer to the PDQ summary on Cancer Screening Overview for more information.) Appendix of Randomized Controlled Trials Health Insurance Plan, United States 1963 [1,2] | Age at entry: 40 to 64 years. | | Randomization: Individual, but with significant imbalances in the distribution of women between assigned arms, as evidenced by menopausal status (P < .0001) and education (P = .05). | | Sample size: 30,000 to 31,092 in study group and 30,565 to 30,765 in control group. | | Consistency of reports: Variation in sample size reports. | | Intervention: Annual two-view mammography (MMG) and clinical breast examination (CBE) for 3 years. | | Control: Usual care. | | Compliance: Nonattenders to first screening (35% of the screened population) were not reinvited. | | Contamination: Screening MMG was not available outside the trial, but frequency of CBE performance among control women is unknown. | | Cause of death attribution: Women who died of breast cancer that had been diagnosed before entry into the study were excluded from the comparison between the screening and control groups. However, these exclusions were determined differently within the two groups. Women in the screening group were excluded based on determinations made during the study period at their initial screening visits. These women were dropped from all further consideration in the study. By design, controls did not have regular clinic visits, so the prestudy cancer status of control patients was not determined. When a control patient died and her cause of death was determined to be breast cancer, a retrospective examination was made to determine the date of diagnosis of her disease. If the date preceded the study period, the control patient was excluded from the analysis. This difference in methodology has the potential for a substantial bias in comparing breast cancer mortality between the two groups, and this bias is likely to favor screening. | | Analysis: Follow-up. | | External audit: No. | | Follow-up duration: 18 years. | | Relative risk of breast cancer death, screening versus control (95% confidence interval [CI]): 0.71 (0.55-0.93) at 10 years and 0.77 (0.61-0.97) at 15 years. | | Comments: The MMGs were of poor quality compared with those of later trials, because of outdated equipment and techniques. One should remember that the intervention consisted of both MMG and CBE. Major concerns about trial performance are the validity of the initial randomization and the differential exclusion of women with a prior history of breast cancer. |
Malmo, Sweden 1976[3,4] | Age at entry: 45 to 69 years. | | Randomization: Individual, within each birth-year cohort for the first phase, MMG screening trial (MMST I). Individual for the entire birth cohort 1933 to 1945 for MMST II but with variations imposed by limited resources. Validation by analysis of age in both groups shows no significant difference. | | Exclusions: In a Swedish meta-analysis, there were 393 women with pre-existing breast cancer excluded from the intervention group, and 412 from the control group. Overall, however, 86 more women were excluded from the intervention group than from the control group. | | Sample size: 21,088 study and 21,195 control. | | Consistency of reports: No variation in patient numbers. | | Intervention: Two-view MMG every 18 to 24 months × 5. | | Control: Usual care, with MMG at study end. | | Compliance: Participants migrating from Malmo (2% per year) were not followed. The participation rate of study women was 74% for the first round and 70% for subsequent rounds. | | Contamination: 24% of all control women had at least one MMG, as did 35% of the control women aged 45 to 49 years. | | Cause of death attribution: 76% autopsy rate in early report, lower rate later. Cause of death assessment blinded for women with a breast cancer diagnosis. Linked to Swedish Cause of Death Registry. | | Analysis: Evaluation, initially. Follow-up analysis, as part of the Swedish meta-analysis.[5] | | External audit: No. | | Follow-up duration: 12 years. | | Relative risk of breast cancer death, screening versus control (95% CI): 0.81 (0.62-1.07). | | Comments: Evaluation analysis required a correction factor for the delay in the performance of MMG in the control group. The two Malmo trials, MMST I and MMST II, have been combined for most analyses. |
Östergötland (County E of Two-County Trial), Sweden 1977[6,7,8] | Age at entry: 40 to 74 years. | | Randomization: Geographic cluster, with stratification for residence (urban or rural), socioeconomic factors and size. Baseline breast cancer incidence and mortality were comparable between the randomly assigned geographic clusters. The study women were older than the control women, P < .0001, which should not have had a major effect on the outcome of the trial. | | Exclusions: Women with pre-existing breast cancer were excluded from both groups, but the numbers are reported differently in different publications. The Swedish meta-analysis excluded all women with a prior breast cancer diagnosis, regardless of group assignment. | | Sample size: Variably reported, ranging from 38,405 to 39,034 in study and from 37,145 to 37,936 in control. | | Consistency of reports: Variable. | | Intervention: Three single-view MMGs every 2 years for women younger than 50 years and every 33 months for women 50 years and older. | | Control: Usual care, with MMG at study end. | | Compliance: 89% screened. | | Contamination: 13% of women in the Two-County trial had MMG as part of routine care, mostly in 1983 and 1984. | | Cause of death attribution: Determined by a team of local physicians. When results were recalculated in the Swedish meta-analysis, using data from the Swedish Cause of Death Registry, there was less benefit for screening than had been previously reported. | | Analysis: Evaluation initially, with correction for delay in control group MMG. Follow-up analysis, as part of the Swedish meta-analysis.[5] | | External audit: No. However, breast cancer cases and deaths were adjudicated by a Swedish panel that included the trial's investigators.[9] | | Follow-up duration: 12 years. | | Relative risk of breast cancer death, screening versus control (95% CI): 0.82 (0.64-1.05) Östergötland. | | Comments: Concerns were raised about the randomization methodology and the evaluation analysis, which required a correction for late performance of the control group MMG. The Swedish meta-analysis resolved these questions appropriately. |
Kopparberg (County W of Two-County Trial), Sweden 1977 [6,7,8] | Age at entry: 40 to 74 years. | | Randomization: Geographic cluster, with stratification for residence (urban or rural), socioeconomic factors and size. The process for randomization has not been described. The study women were older than the control women, P < .0001, but this should not have had a major effect on the outcome of the trial. | | Exclusions: Women with pre-existing breast cancer were excluded from both groups, but the numbers are reported differently in different publications. | | Sample size: Variably reported, ranging from 38,562 to 39,051 in intervention and from 18,478 to 18,846 in control. | | Consistency of reports: Variable. | | Intervention: Three single-view MMGs every 2 years for women younger than 50 years and every 33 months for women aged 50 years and older. | | Control: Usual care, with MMG at study end. | | Compliance: 89% participation. | | Contamination: 13% of women in the Two-County trial had MMG as part of routine care, mostly between 1983 and 1984. | | Cause of death attribution: Determined by a team of local physicians (see Östergötland). | | Analysis: Evaluation. | | External audit: No. However, breast cancer cases and deaths were adjudicated by a Swedish panel that included the trial's investigators.[9] | | Follow-up duration: 12 years. | | Relative risk of breast cancer death, screening versus control (95% CI): 0.68 (0.52-0.89). |
Edinburgh, United Kingdom 1976 [10] | Age at entry: 45 to 64 years. | | Randomization: Cluster by physician practices, though many randomization assignments were changed after study start. Within each practice, there was inconsistent recruitment of women, according to the physician's judgment about each woman's suitability for the trial. Large differences in socioeconomic status between practices were not recognized until after the study end. | | Exclusions: More women (338) with pre-existing breast cancer were excluded from the intervention group than from the control group (177). | | Sample size: 23,226 study and 21,904 control. | | Consistency of reports: Good. | | Intervention: Initially, two-view MMG and CBE; then annual CBE, with single-view MMG in years 3, 5, and 7. | | Control: Usual care. | | Compliance: 61% screened. | | Contamination: None. | | Cause of death attribution: Cancer Registry Data. | | Analysis: Follow-up. | | External audit: No. | | Follow-up duration: 10 years. | | Relative risk of breast cancer death, screening versus control (95% CI): 0.84 (0.63-1.12). | | Comments: Randomization process was flawed. Socioeconomic differences between study and control groups probably account for the higher all-cause mortality in control women compared with screened women. This difference in all-cause mortality was four times greater than the breast cancer mortality in the control group, and therefore, may account for the higher breast cancer mortality in the control group compared with screened women. Although a correction factor was used in the final analysis, this may not adjust the analysis sufficiently. |
The study design and conduct make these results difficult to assess or combine with the results of other trials. NBSS-1, Canada 1980 [11] | Age at entry: 40 to 49 years. | | Randomization: Individual volunteers, with names entered successively on allocation lists. Although criticisms of the randomization procedure have been made, a thorough independent review found no evidence of subversion and that subversion on a scale large enough to affect the results was unlikely.[12] | | Exclusions: Few, balanced between groups. | | Sample size: 25,214 study (100% screened after entry CBE) and 25,216 control. | | Consistency of reports: Good. | | Intervention: Annual two-view MMG and CBE for 4 to 5 years. | | Control: Usual care. | | Compliance: Initially 100%, decreased to 85.5% by screen five. | | Contamination: 26.4% in usual care group. | | Cause of death attribution: Death certificates, with review of questionable cases by a blinded review panel. Also linked with the Canadian Mortality Data Base, Statistics Canada. | | Analysis: Follow-up. | | External audit: Yes. Independent, with analysis of data by several reviewers. | | Follow-up duration: 25 years. | | Relative risk of breast cancer death, screening versus control: 1.09 (95% CI, 0.80-1.49). | | Comments: This is the only trial specifically designed to study women aged 40 to 49 years. Cancers diagnosed at entry in both study and control groups were included. Concerns were expressed before the completion of the trial about the technical adequacy of the MMGs, the training of the radiologists, and the standardization of the equipment, which prompted an independent external review. The primary deficiency identified by this review was the use of the mediolateral view from 1980 to 1985 instead of the mediolateral oblique view, which was used after 1985.[13] Subsequent analyses found the size and stage of the cancers detected mammographically in this trial to be equivalent to those of other trials.[14] This trial and NBSS-2 differ from the other RCTs in the consistent use of adjuvant hormone and chemotherapy following local breast cancer therapy in women with axillary node-positive disease. |
NBSS-2, Canada 1980 [15] | Age at entry: 50 to 59 years. | | Randomization: Individual volunteer (see NBSS-1). | | Exclusions: Few, balanced between groups. | | Sample size: 19,711 study (100% screened after entry CBE) and 19,694 control. | | Intervention: Annual two-view MMG and CBE. | | Control: Annual CBE. | | Compliance: Initially 100%, decreased to 86.7% by screen five in the MMG and CBE group. Initially 100%, decreased to 85.4% by screen five in the CBE only group. | | Contamination: 16.9% of the CBE only group. | | Cause of death attribution: Death certificates, with review of questionable cases by a blinded review panel. Also linked with the Canadian Mortality Data Base, Statistics Canada. | | Analysis: Follow-up. | | External audit: Yes. Independent with analysis of data by several reviewers. | | Follow-up duration: 25 years. | | Relative risk of breast cancer death, screening versus control: 1.02 (95% CI, 0.77-1.36) | | Comments: This trial is unique in that it compares one screening modality to another and does not include an unscreened control. Regarding criticisms and comments about this trial, see NBSS-1. |
Stockholm, Sweden 1981 [16] | Age at entry: 40 to 64 years. | | Randomization: Cluster by birth date. There were two subtrials with balanced randomization in the first and a significant imbalance in the second with 508 more women in the screened group than the control. | | Exclusions: Inconsistently reported. | | Sample size: Between published reports, the size declined from 40,318 to 38,525 in the intervention group and rose from 19,943 to 20,978 in the control group. | | Consistency of reports: Variable. | | Intervention: Single-view MMG every 28 months × 2. | | Control: MMG at year 5. | | Compliance: 82% screened. | | Contamination: 25% of women entering the study had MMG in the 3 years before entry. | | Cause of death attribution: Linked to Swedish Cause of Death Registry. | | Analysis: Evaluation, with 1-year delay in the posttrial MMG in the control group. Follow-up analysis as part of the Swedish meta-analysis.[5] | | External audit: No. | | Follow-up duration: 8 years. | | Relative risk of breast cancer death, screening versus control (95% CI): 0.80 (0.53-1.22). | | Comments: Concerns exist about randomization, especially in the second subtrial, exclusions, and the delay in control group MMG. Inclusion of these data in the Swedish meta-analysis resolves many of these questions. |
Gothenburg, Sweden 1982 | Age at entry: 39 to 59 years. | | Randomization: Complex; cluster randomly assigned within birth year by day of birth for older group (aged 50-59 years) and by individual for younger group (aged 39-49 years); ratio of study to control varied by year depending on MMG availability (randomization took place 1982-1984). | | Exclusions: A similar proportion of women were excluded from both groups for prior breast cancer diagnosis (1.2% each). | | Sample size: Most recent publication: 21,650 invited; 29,961 control. | | Consistency of reports: Variable. | | Intervention: Initial two-view MMG, then single-view MMG every 18 months × 4. Single-read first three rounds, then double-read. | | Control: Control group received one screening exam approximately 3 to 8 months after the final screen in study group. | | Cause of death attribution: Linked to Swedish Cause of Death Registry; also used an independent endpoint committee. | | Analysis: Both evaluation and follow-up methods.[5] | | External audit: No. | | Follow-up duration: 12 to14 years. | | Relative risk of breast cancer death, screening versus control (95% CI): Aged 39 to 59 years: 0.79 (0.58-1.08) [evaluation]; 0.77 (0.60-1.00) [follow-up]. | | Comments: No reduction for women aged 50 to 54 years, but similar reductions for other 5-year age groups. | | Conclusions: Delay in the performance of MMG in the control group and unequal numbers of women in invited and control groups (complex randomization process) complicates interpretation. |
AGE Trial[17,18] | Age at entry: 39 to 41 years. | | Randomization: Individuals from lists of general practitioners in geographically defined areas of England, Wales, and Scotland; allocation was concealed. | | Exclusions: Small (n = 30 in invited group and n = 51 in not invited group) number excluded in each group because individuals could not be located or were deceased. | | Sample size: 160,921 (53,884 invited; 106,956 not invited). | | Consistency of reports: Not applicable. | | Intervention: Invited group aged 48 years and younger offered annual screening by MMG (double-view first screen, then single mediolateral oblique view thereafter); 68% accepted screening on first screen and 69% to 70% were reinvited (81% attended at least one screen). | | Control: Those who were not invited received usual medical care, unaware of their participation, and few were screened before randomization. | | Cause of death attribution: From the National Health Service (NHS) central register, death certificate code accepted. | | Analysis: Follow-up method was intention-to-treat (although all women aged 50 years would be offered screening by NHS). | | External audit: None. | | Follow-up duration: 10.7 years. | | Relative risk of breast cancer death, screening versus control (95% CI): 0.83 (0.66-1.04). | | Conclusions: Not a statistically significant result, but fits with other studies. | | Follow-up duration: Restricted to 10 years from randomization. | | Relative risk of breast cancer death, screening versus control: 0.75 (0.58-0.97). | | Conclusions: A statistically significant result. | | Follow-up duration: Median 17.7 years. | | Relative risk of breast cancer death, screening versus control: 0.88 (0.74-1.04). | | Conclusions: Not a statistically significant result. | | Follow-up duration: Median 17.7 years. | | Relative risk of all-cause mortality, screening versus control: 0.98 (0.93-1.03). | | Conclusions: Not a statistically significant result. |
The reduction in breast cancer mortality at a median follow-up of 17.7 years corresponds to an absolute risk reduction of 0.1 of 1,000 (or 1 of 10,000) fewer deaths. The evidence is inadequate to support the conclusion of a clinically significant breast cancer mortality reduction attributable to initiation of screening mammography among women aged 39 to 49 years. The reported mortality reduction is a very small, transient reduction in breast cancer mortality based on a nonstandard imaging schedule, nonstandard imaging protocol, and nonstandard threshold for biopsy; therefore, it is of uncertain relevance to the general population. In absolute terms, it corresponds to an absolute risk reduction of 0.1 of 1,000 (or 1 of 10,000) fewer deaths. Additionally, the mortality reduction is based on a re-analysis of the original data set, which was not statistically significant, and the recalculation of breast cancer mortality in a subgroup restricted to 10 years of follow-up. At 20 years of follow-up, there was no statistically significant decrease in risk of breast cancer or all-cause mortality.[18] The evidence is inadequate to make a clear determination of the magnitude of overdiagnosis. Because the evidence is based on subgroup analysis and nonstandard imaging schedule, nonstandard imaging protocol, and a nonstandard threshold for biopsy with uncertain relevance to the general population, it does not support the investigators' conclusion of "at worst a small amount of overdiagnosis."[18] References:
-
Shapiro S, Venet W, Strax P, et al.: Ten- to fourteen-year effect of screening on breast cancer mortality. J Natl Cancer Inst 69 (2): 349-55, 1982.
-
Shapiro S: Periodic screening for breast cancer: the Health Insurance Plan project and its sequelae, 1963-1986. Baltimore, Md: Johns Hopkins University Press, 1988.
-
Andersson I, Aspegren K, Janzon L, et al.: Mammographic screening and mortality from breast cancer: the Malmö mammographic screening trial. BMJ 297 (6654): 943-8, 1988.
-
Nyström L, Rutqvist LE, Wall S, et al.: Breast cancer screening with mammography: overview of Swedish randomised trials. Lancet 341 (8851): 973-8, 1993.
-
Nyström L, Andersson I, Bjurstam N, et al.: Long-term effects of mammography screening: updated overview of the Swedish randomised trials. Lancet 359 (9310): 909-19, 2002.
-
Tabár L, Fagerberg CJ, Gad A, et al.: Reduction in mortality from breast cancer after mass screening with mammography. Randomised trial from the Breast Cancer Screening Working Group of the Swedish National Board of Health and Welfare. Lancet 1 (8433): 829-32, 1985.
-
Tabàr L, Fagerberg G, Duffy SW, et al.: Update of the Swedish two-county program of mammographic screening for breast cancer. Radiol Clin North Am 30 (1): 187-210, 1992.
-
Tabar L, Fagerberg G, Duffy SW, et al.: The Swedish two county trial of mammographic screening for breast cancer: recent results and calculation of benefit. J Epidemiol Community Health 43 (2): 107-14, 1989.
-
Holmberg L, Duffy SW, Yen AM, et al.: Differences in endpoints between the Swedish W-E (two county) trial of mammographic screening and the Swedish overview: methodological consequences. J Med Screen 16 (2): 73-80, 2009.
-
Roberts MM, Alexander FE, Anderson TJ, et al.: Edinburgh trial of screening for breast cancer: mortality at seven years. Lancet 335 (8684): 241-6, 1990.
-
Miller AB, To T, Baines CJ, et al.: The Canadian National Breast Screening Study-1: breast cancer mortality after 11 to 16 years of follow-up. A randomized screening trial of mammography in women age 40 to 49 years. Ann Intern Med 137 (5 Part 1): 305-12, 2002.
-
Bailar JC 3rd, MacMahon B: Randomization in the Canadian National Breast Screening Study: a review for evidence of subversion. CMAJ 156 (2): 193-9, 1997.
-
Baines CJ, Miller AB, Kopans DB, et al.: Canadian National Breast Screening Study: assessment of technical quality by external review. AJR Am J Roentgenol 155 (4): 743-7; discussion 748-9, 1990.
-
Fletcher SW, Black W, Harris R, et al.: Report of the International Workshop on Screening for Breast Cancer. J Natl Cancer Inst 85 (20): 1644-56, 1993.
-
Miller AB, Baines CJ, To T, et al.: Canadian National Breast Screening Study: 2. Breast cancer detection and death rates among women aged 50 to 59 years. CMAJ 147 (10): 1477-88, 1992.
-
Frisell J, Eklund G, Hellström L, et al.: Randomized study of mammography screening--preliminary report on mortality in the Stockholm trial. Breast Cancer Res Treat 18 (1): 49-56, 1991.
-
Moss SM, Cuckle H, Evans A, et al.: Effect of mammographic screening from age 40 years on breast cancer mortality at 10 years' follow-up: a randomised controlled trial. Lancet 368 (9552): 2053-60, 2006.
-
Moss SM, Wale C, Smith R, et al.: Effect of mammographic screening from age 40 years on breast cancer mortality in the UK Age trial at 17 years' follow-up: a randomised controlled trial. Lancet Oncol 16 (9): 1123-32, 2015.
Changes to This Summary (04 / 27 / 2017)The PDQ cancer information summaries are reviewed regularly and updated as new information becomes available. This section describes the latest changes made to this summary as of the date above. Breast Cancer Screening Concepts Added text to state that according to the Physician's Insurance Association of America (PIAA), delay in diagnosis of breast cancer and false-negative mammogram interpretations are a common cause of medical malpractice litigation; PIAA data from 2001 through 2011 note that breast cancer claims had the largest total indemnity payment and that diagnostic errors ranked as the top alleged error associated with breast cancer (cited Physician's Insurance Association of America as reference 5). Breast Cancer Screening Imaging Modalities Added text to state that an analytic approach was used to approximate the magnitude of overdiagnosis and the contributions of screening versus treatment to breast cancer mortality reduction; the shift in the size distribution of breast cancers in the United States from 1975 to 2012, an interval that spans the period from before the introduction of mammography to after its widespread dissemination, was investigated using Surveillance, Epidemiology, and End Results (SEER) data in women aged 40 years and older under the assumption that the rate of clinically meaningful breast cancer was stable over this period; there was an indication of the potential for screening to lower mortality reflected in a declining incidence of larger tumors, however, reduction in breast cancer case fatality was also documented, with the change for large tumors likely primarily caused by improvements in therapy; this decline in size-specific case fatality suggested that improved treatment was responsible for about two-thirds of the reduction in breast cancer mortality (cited Welch et al. as reference 62). Added Figure 2, Screening Mammography and Increased Incidence of Invasive Breast Cancer. Variables Associated with Accuracy Added text to state that false-positive biopsy rates are also higher at facilities that perform diagnostic mammography and serve vulnerable women than at facilities that perform diagnostic mammography and serve nonvulnerable women; this may reflect radiologist concerns that vulnerable populations may be less likely to follow up after an abnormality is noted when follow-up includes a short-interval follow-up or a clinic visit, and thus, radiologists may be more likely to recommend a biopsy as opposed to short-interval follow-up; this may also represent radiologist concerns that this population may have a slightly higher cancer prevalence (cited Goldman et al. as reference 23). Harms of Screening Added text to state that an analytic approach was used to approximate the magnitude of overdiagnosis and the contributions of screening versus treatment to breast cancer mortality reduction; the shift in the size distribution of breast cancers in the United States from 1975 to 2012, an interval that spans the period from before the introduction of mammography to after its widespread dissemination, was investigated using SEER data in women aged 40 years and older under the assumption that the rate of clinically meaningful breast cancer was stable over this period (cited Welch et al. as reference 29). Also added text to state that when women diagnosed from 1975 to 1979 were compared with women diagnosed from 2008 to 2012, the incidence of large tumors decreased by 30 cases per 100,000 women, whereas the incidence of invasive tumors smaller than 2 cm and ductal carcinoma in situ increased by 162 cases per 100,000 women, suggesting overdiagnosis of 132 cases per 100,000 women. Added text about a systematic review of 22 studies that invested pain and discomfort associated with mammography and found that the prevalence of pain varied widely; the degree of pain was associated with the stage of menstrual cycle, anxiety, and premammography anticipation of pain (cited Armstrong et al. as reference 32). Added text to state that research into whether or not the psychological impact of a false-positive test is long standing has found mixed results; a cohort study in Spain in 2002 found immediate psychological impact of receiving a false-positive mammogram, but these results dissipated within a few months (cited Sandin et al. as reference 40). Also added text to state that a cohort study in Denmark in 2013 measuring the psychological effects of a false positive several years past the event found long-term negative psychological consequences associated with the experience of receiving a false-positive mammogram (cited Brodersen et al. as reference 41). This summary is written and maintained by the PDQ Screening and Prevention Editorial Board, which is editorially independent of NCI. The summary reflects an independent review of the literature and does not represent a policy statement of NCI or NIH. More information about summary policies and the role of the PDQ Editorial Boards in maintaining the PDQ summaries can be found on the About This PDQ Summary and PDQ® - NCI's Comprehensive Cancer Database pages. About This PDQ SummaryPurpose of This Summary This PDQ cancer information summary for health professionals provides comprehensive, peer-reviewed, evidence-based information about breast cancer screening. It is intended as a resource to inform and assist clinicians who care for cancer patients. It does not provide formal guidelines or recommendations for making health care decisions. Reviewers and Updates This summary is reviewed regularly and updated as necessary by the PDQ Screening and Prevention Editorial Board, which is editorially independent of the National Cancer Institute (NCI). The summary reflects an independent review of the literature and does not represent a policy statement of NCI or the National Institutes of Health (NIH). Board members review recently published articles each month to determine whether an article should: - be discussed at a meeting,
- be cited with text, or
- replace or update an existing article that is already cited.
Changes to the summaries are made through a consensus process in which Board members evaluate the strength of the evidence in the published articles and determine how the article should be included in the summary. Any comments or questions about the summary content should be submitted to Cancer.gov through the NCI website's Email Us. Do not contact the individual Board Members with questions or comments about the summaries. Board members will not respond to individual inquiries. Levels of Evidence Some of the reference citations in this summary are accompanied by a level-of-evidence designation. These designations are intended to help readers assess the strength of the evidence supporting the use of specific interventions or approaches. The PDQ Screening and Prevention Editorial Board uses a formal evidence ranking system in developing its level-of-evidence designations. Permission to Use This Summary PDQ is a registered trademark. Although the content of PDQ documents can be used freely as text, it cannot be identified as an NCI PDQ cancer information summary unless it is presented in its entirety and is regularly updated. However, an author would be permitted to write a sentence such as "NCI's PDQ cancer information summary about breast cancer prevention states the risks succinctly: [include excerpt from the summary]." The preferred citation for this PDQ summary is: PDQ® Screening and Prevention Editorial Board. PDQ Breast Cancer Screening. Bethesda, MD: National Cancer Institute. Updated <MM/DD/YYYY>. Available at: https://www.cancer.gov/types/breast/hp/breast-screening-pdq. Accessed <MM/DD/YYYY>. [PMID: 26389344] Images in this summary are used with permission of the author(s), artist, and/or publisher for use within the PDQ summaries only. Permission to use images outside the context of PDQ information must be obtained from the owner(s) and cannot be granted by the National Cancer Institute. Information about using the illustrations in this summary, along with many other cancer-related images, is available in Visuals Online, a collection of over 2,000 scientific images. Disclaimer The information in these summaries should not be used as a basis for insurance reimbursement determinations. More information on insurance coverage is available on Cancer.gov on the Managing Cancer Care page. Contact Us More information about contacting us or receiving help with the Cancer.gov website can be found on our Contact Us for Help page. Questions can also be submitted to Cancer.gov through the website's Email Us. Last Revised: 2017-04-27 Last modified on: 8 September 2017
|
|